A January Summary:
Once again I shall try to summarize what I know about consanguinity and fertility. This begins just like the old "December Summary" but there is new information tacked on at the end. Skip to "New Evidence" if you have been through it before.
The first issue is where are the babies going? Here is a graph of UN data of the world’s birth rate over the past 50 years. It is a few years old, downloaded August, 1208, but in general it is right:
The vertical axis is the average number of children born per woman. The horizontal axis gives the dates of the surveys. The numbers are broken down into rich world, middle world and poor world. Except for children born in the past few years everybody under 50 is in one of these columns; this is ALL THE JELLY BEANS, the entire future of humanity since those over 50 don’t add much to the population. Birth rates are obviously different in different place. Some people may think there is a genetic difference between populations. Jefferson wrote, “All men (persons) are created equal.” That may not be the last word, but it is a good place to start. What we’ll do now is follow the yellow columns down until they are at the level of the red columns then jump back and follow the red columns until they reach the blue columns then jump back and follow the blue columns until the end. Here’s what we get:
It’s all one single curve. You can’t even tell where the cut and pastes happened. On this one Jefferson was right. We are all just alike: we are only at different places along the same line. Notice that the final column levels off and even edges upward slightly. And in fact lots of rich countries have had an increase in their birth rate, not enough to recover, but some. When the experts look at this they say, “The population will reach a maximum of about 10 billion in about 2050 and then it will stabilize.” Cool. And that prediction is based on the assumption that women in the future will have exactly the same number of children at each age as they do now. But that is obviously wrong. If it were true, the line would have to be straight.
The next issue is where does this all lead? Civilizations collapse. Here is the history of southern Mesopotamia. (The Ottomans had a change in the way they recruited their Janissaries, so I treat them as two empires.)
Information taken from R. H. Carling THE WORLD HISTORY CHART International Timeline Inc. Vienna, VA 1985. The experience of Southern Mesopotamia. The vertical axis is The chance of an empire of any age continuing to rule locally for another 50 years. The horizontal axis is the ages of the empires.
Obviously the curve is so clean that there can be only one thing governing the fall of empires. Were that thing something inside the population – the right politics, philosophy, genes, religion or whatever – the line should go up. The less fit should be selected out early leaving more durable cultures. Were the thing outside of the population, climate change or rocks from space, then the line should be horizontal. The truth is not somewhere in between. The truth contradicts both classes of theory of history. Civilizations age and die with about a three hundred year maximum life. Since the cause is neither within the population nor external it can only be the very fact of a large population cooperating. The one thing you can be sure of in a civilization is that there have to be a lot of people working together.
This is not just some sort of weird thing about Mesopotamia. Here is a similar graph where I pool, for statistical reasons, Rome, the classical Mayans and the Anasazi of Chaco Canyon all of which had multiple regime changes.

Information taken from BBC and Tainter. The difference between the curves is trifling, well within the limits of the noise you would expect with such small numbers. Three hundred years is still obvious.
It does not have to be such a large population. I refer to grand civilizations because they are well studied. But one community of rather modest size was studied exhaustively.
This is from a study done by Jarred Diamond of the people in Long House valley. “Actual population is figured from the number of houses in which there was charcoal in the hearth from that year. “Modelled (sic)population” is figured out from tree ring width. Diamond’s point was that the people in the valley depended on how much rain there was. But that would mean people moving in only to starve. The other possibility is that they were cultivating trees to meet their needs; the size of the tree rings depended on how many people there were. The Pattern is two peaks and a crash.
Jared M. Diamond, “Life with the Artificial Anasazi,” NATURE, vol 419 no 6907, October 10, 2002 p 567
Explosive growth starts at about the year 1000, maybe earlier. The ambiguity about the beginning will haunt you as long as you think about such matters. The finality of the end will also. People in this culture obviously move in groups. Was there anybody there who moved out at the end? If so, that did not break the trend line.
The beginning is clearer when one looks at Chinese dynasties. Traditionally in China the imperial household was privileged. Just about everybody else was a primary provider. The administrative middle class people were eunuchs, who of course did not contribute to the demographics.
Information taken from John B. Teeple TIMELINES OF WORD HISTORY, DK Publishing, New York, NY, 2006, page 554, 555 Chinese dynasties. The vertical axis is the chance that a dynasty of that age will survive another 50 years. The horizontal axis is the age of the dynasties.
Given a little stochastic chatter, the 300 year brick wall is obvious. In spite of the poor statistics from low numbers the double peak is still visible as a slight notch. I take it that when the imperial household is numerous then the dynasty is safe. Loyalty is a strong force in China. But loyalty alone cannot create babies. When the ranks of the imperial household are thin, then there is danger. It is the same curve followed by the much more modest farmers of Long House Valley.
Japan looks about the same.
Information taken from John B. Teeple TIMELINES OF WORD HISTORY, DK Publishing, New York, NY, 2006, page 554, 555 Japanese dynasties. The vertical axis is the chance that a dynasty of that age will survive another 50 years. The horizontal axis is the age of the dynasties.
Got it? Same time course. The notch happens in exactly the same place. There is one obvious difference. In the first fifty years is a bit dangerous. Loyalty is strong is Japan as well, but unlike China Japan has had powerful noble houses. During the first generation or two there might be a little jockeying for power. After that the imperial household is secure. This of course is just an interpretation from the numbers. A careful study of the history would be most interesting? Do dynasties fall during the notch for the same reasons they fall during their most robust generations?
This pattern is not limited to humans. Here is data from mouse plagues in Australia and New Zealand. Every now and then the number of mice suddenly skyrockets. They have mouse counting stations and here are their counts:
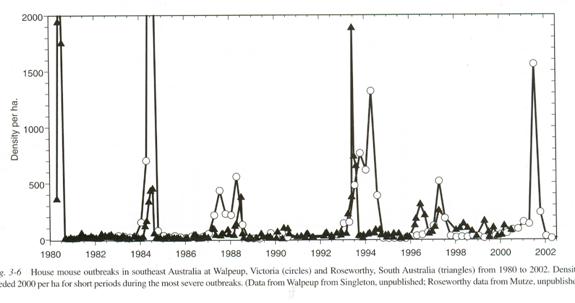
Information from The Mouse in Biomedical Research second edition Volume 1 History, Wild Mice and Genetics, chapter 3 “The Secret World of Wild Mice” section VI Population Dynamics part C. Population Eruptions (Mouse Plagues in Australia; population eruptions in New Zealand) Grant R. Singleton and Charles J. Krebs editors James G. Fox, Muriel T Davisson, Fred W. Quimby, Stephen W. Barhold, Chritian E. Newcomer and Abigail L. Smith Elsever Burlington 2007 page 39. The caption reads: House mouse outbreaks in southeast Australia at Walpeup, Victoria (Circles) and Roseworthy, South Australia (Triangles) from 1980 to 2002. Densities exceeded 2,000 per ha (hectare) for short periods during the most severe outbreaks. Data from Walpeup from Singleton, unpublished; Roseworthy data from Mutze, unpublished.)
Mouse plagues occur a year or so after a rain. We could have guessed that. The drought pushes the population down, increasing fertility, and so the population explodes. They have excluded predation and starvation as causes of the collapse of the plagues. A virus has been suspected but not proven. But of course the double peak pattern is obvious on at least three occasions. Guessing that the time of a human generation is about 30 years and a wild mouse generation about two months the time course is the same also.
By this time the next issue is pressing. As the population rises, obviously consanguinity must fall. Each member of the population is less related on average to each other member. So is it true that if consanguinity falls then fertility must fall. The answer is, “Absolutely.”
A study was done in Denmark that compared fertility with the distance between the birthplaces of couples (marital radius).This is what they found.
Taken from Comment on “An Association between Kinship and Fertility of Human Couples,” Rodrigo Labouriau and António Amorim, SCIENCE vol. 322 no. 5908 December 12, 2008 page 1634. For the whole story also see Human Fertility Increases with marital radius. Rodrigo Labouriau and António Amorim. GENETICS volume 178 January 2008 page 603
Since the authors chose to use distance rather than area, the horizontal axis is not strictly proportional to the population from which the couple came but to its square root. If you correct for that the peak bunches up to the left and the straight line decline out past 100 kilometers becomes a curve that is concave upward, tending to level off. In their earlier paper the others explained that when they controlled for consanguinity effects – the size of the community where the couple lived and marital radius – there was no effect of income or education on family size. In other words, unless there is such a high degree of consanguinity that inbreeding sets in – and as we shall see it takes a lot – then indeed fertility falls with consanguinity.
Denmark has long been an agricultural land with small stable villages and little mobility in the countryside. Marital radius was thus an appropriate surrogate for the inverse of consanguinity. Iceland has been more typically a pastoral and fishing culture, the people less bound to any particular plot of ground. On the other hand the genealogy of Iceland is exhaustive and a thousand years old. So consanguinity could be calculated simply by going back ten generations and totaling the number of shared ancestors. This was translated in the following study into second-cousin-or-closer (meaning first cousin once removed on average), third-cousin-or-closer (second cousin once removed) and so forth. The translation is not perfect. In Standard English a person with whom you share a great grandparent but have no nearer shared kin is your second cousin however many great great grandparents you might share. With this caveat, this is what a study in Iceland found in the first generation.
An Association between Kinship and Fertility of Human Couples Agnar Helgason et al. SCIENCE vol. 329 no. 5864 February 8, 2008 page 813 – 816
There you have it. Less kinship means fewer children in the first generation. Period. Full stop. The end. No ifs, ands or buts. Those error bars are two standard deviations. They are so tight that there is simply no room for any other significant effect. Actually, the numbers are “normalized” whereby the birth rate of a couple is compared with the nationwide birth rate at the same time. What is driving the nationwide birthrate seems to me to be consanguinity. Otherwise we should see some effect of that driver in first generation fertility, and we don’t.
Now let me explain two things: pre-zygotic infertility and post-zygotic infertility. A zygote in Greek is a pair of oxen yoked so they can work together. In biology it is the fertilized egg. If you have infertility that prevents a sperm from reaching or entering an egg, that is pre-zygotic. If you have infertility because normal eggs and sperm are not made or any other cause that is related to the individual that prevents offspring, that is post-zygotic. That makes little sense to me. If I can’t get a date (or more commonly an attractive woman breaks a date) is it because I am a toad and it’s post-zygotic or because she is picky and it’s pre-zygotic? It’s a cycle; what is post for one generation is pre for the next.
But when you do a computer simulation, the computer makes it quite clear. Do you mean pre-zygotic or post-zygotic. The source code is different.
Here is an example of fertility in a virtual population limited by a post-zygotic process followed over time:
The curve is truncated because the program can only deal with a finite number of members of the population and their potential offspring, but as you see the population can oscillate with a characteristic shape and time course. The curve is skewed toward the left. In this case the population died out after two cycles. With this particular set a parameters it usually dies out after the first cycle; it can go on for a number of cycles. If the population size is limited, using the same parameters, it will be stable and can go on indefinitely.
Here, by contrast is a virtual population affected by pre-zygotic infertility. Here it is going on for a thousand generations at a population size of 100:
Generations on the horizontal axis and number of offspring for the entire population on the vertical. This population will go on a long time.
Then here is a population that is just the same except it is allowed to increase to 1,000.
Look how the population is leveling out. It’s still well above replacement, which would be 1,000 offspring in a population of 1,000. It falls and then it levels off. You can practically hear the experts saying, “The population is going to stabilize at about generation 139.” Yeah, sure.
Well absolute pre-zygotic infertility is a late change in speciation. Lots of different species can be crossed for one generation. A donkey and a horse can make a mule or a jenny, neither of which is fertile.
The first generation infertility seen in the Iceland study is probably mostly pre-zygotic. The couple gets together and does what it usually takes to have children and their success in this is determined by their consanguinity. Either the sperm and egg cannot form a zygote or once formed the zygote does not develop to the point that a menstrual period is missed.
Of the two possibilities, the former is more likely for two reasons. For one thing, modern infertility treatment involves injecting a sperm directly into an ovum. It works more often than not so the difficulty was with the sperm entering the ovum. It could be a matter of feeble sperm and thus be post-zygotic, but since the sperm would have been much more likely to succeed, say with a first cousin once removed, the mechanism is probably pre-zygotic. The other reason to suspect a pre-zygotic mechanism is that sperm are able to recognize kindred sperm. In the deer mouse sperm will form up with kindred sperm to form a sort of a flying wedge. They will not do this with unrelated sperm. If a sperm can recognize related sperm it is reasonable to suspect (although the study begs to be done) that sperm can recognize related ova.
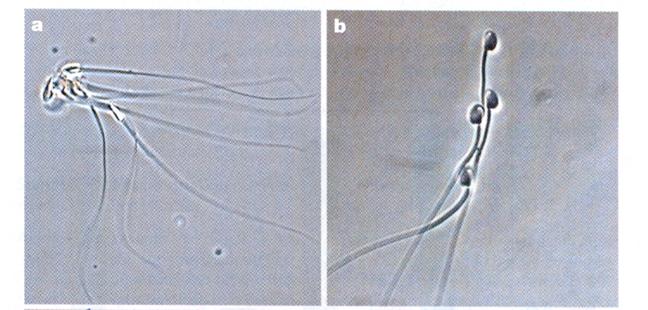 Pictures from Competition Drives Cooperation Among Closely Related Sperm of Deer Mice, Heidi S. Fisher and Hopi E. Hoekstra, NATURE vol. 463. no. 7282 February 11, 2010 page 801.
Returning to the Iceland study it was found that the number of grandchildren was determined by the consanguinity of a couple.
An Association between Kinship and Fertility of Human Couples Agnar Helgason et al. SCIENCE vol. 329 no. 5864 February 8, 2008 page 813 – 816
This time we are looking at post-zygotic infertility. Now, as in the Danish study, we see evidence for inbreeding depression. The number of grandchildren is substantially less for first cousins once removed than for second cousins once removed. The graph rather underestimates the degree of inbreeding depression. You must bear in mind that those grandchildren are the offspring of people who were the result of a mating that produced maximum children. None the less, the number of grandchildren of a second-cousin-or-closer match is greater than for a seventh cousin or more distant match.
Sadly the Icelandic study did not look at the next generation. How do the numbers of great grandchildren play out? (They clearly have the data to answer that question. Again this is a study begging to be done.)
On the other hand, a study published in the Proceedings of the Royal Society B, compared the fertility of rich couples and looked at grandchildren and great grandchildren. The common thought was that rich people have fewer children but invest more in them and can thus expect more grandchildren than can poorer people. What they found in the first two generations was this:
and this:
Low fertility increases descendant socioeconomic position but reduces long-term fitness in a modern post-industrial society Proc. R. Soc. B 2012 279, 4342-4351 first published online 29 August 2012 Anna Goodman, Ilona Koupil and David W. Lawson
The coordinates are designed by an expert for experts and I find them a bit difficult. Basically the horizontal axis is the cumulative number of children and the horizontal axis is the number of children. In the upper graph the dotted line represents the number of children for poorer people in the first generation. The solid line shows the number for rich people, which at the extreme right (the only value of interest here) is lower than the number for poor people. In the lower graph the dotted line represents the number of children for poor people in the second generation (grandchildren) and again the solid line for rich people winds up lower. And the graphs are almost identical. As with the Icelandic data the second generation penalty is essentially identical with the first. So the notion that rich people make a bigger investment in their children and are rewarded with a premium number of grandchildren must be dismissed.
Now I take wealth to be a surrogate for decreased consanguinity. Rich folks move around more and have a broader social horizon. If there was any doubt before, it should be laid to rest now. The curves are identical for the two parameters evaluated.
But this study happily went on to look at the next generation. They found this:
Low fertility increases descendant socioeconomic position but reduces long-term fitness in a modern post-industrial society Proc. R. Soc. B 2012 279, 4342-4351 first published online 29 August 2012 Anna Goodman, Ilona Koupil and David W. Lawson
In terms of great grandchildren things are worse. They are a lot worse. Just when one might feel justified in thinking an effect must have worn off, the effect is just beginning to bite. They consistently found that rich people had rich offspring, but as far as consanguinity goes there is no recovery. Even if the grandchildren were poor they would be exceedingly unlikely to go back to the old family farm to find a mate. The downward acceleration of fertility recalls the plunge in fertility we have seen elsewhere.
So in answer to the question of whether humans have reduced fertility if there is inadequate consanguinity we can say not only that it’s true but that there is pre-zygotic and post-zygotic infertility involved. If you go back and look at the first computer simulation (the post-zygotic one) and the third computer simulation (a pre-zygotic one) you may be able to superimpose the curves in your mind and come out with the time course of infertility in Long House Valley, among Asian dynasties and in mouse plagues. For the southern Mesopotamian experience as for the Roman-Mayan-Chaco Canyon experience the starting point is not clear and the double peak blurs out into a single inexorable decline.
Do not think people are exceptional in this. It is a biological principle unrelated to wealth, education or choice except insofar as choice is reflected in mating choice. Here is a study that compiled thousands of field counts of animals over successive years. Typically this is what was found.
On the Regulation of Populations of Mammals, Birds, Fish and Insects, Richard M. Sibly, Daniel Barker, Michael C. Denham, Jim Hope and Mark Pagel SCIENCE vol. 309 July 22, 2005 page 609
And if you are not heartily sick of seeing the same curve, here is a computer simulation modeling a series of populations that vary in maximum size and are constrained by a constant amount of post-zygotic fertility depression from a post-zygotic mechanism.
Vertical axis is the average number of offspring in generation 1,000. Horizontal axis is increasing population size. Because some populations went extinct, I calculated average offspring three ways. In the upper line I simply eliminated from the calculation every population that went extinct. The result is inappropriately sanguine. The lower two lines are so similar that they superimpose. One was calculated simply by dividing the final total offspring by the original number of populations. (There were ten runs averaged for each population size.) The other line was calculated by noting how many generations a dying population had lasted and dividing that into the starting population (100 in each case) and getting an average fall in population. A portion of that equal to the proportion that went extinct was subtracted from the number in the upper line.
The curve for a pre-zygotic mechanism was about the same except under conditions of intense inbreeding, which we will examine toward the end of this essay.
The next issue by now is pressing. If it is biologically advantageous, indeed mandatory, for animals to mate with kin, why is there no instinct to do so? Indeed there is such an instinct. But before looking at it, there are other ways that gene pool size is constrained among animals. Animals generally are highly territorial. They tend to stay put. That means that any animal of the same species has probably stayed put and is likely to be kin. Then there are things like the migration of salmon; they reliably swim back to their natal brook having spent years churning the open sea. In that brook they find something they can find nowhere else on earth, which is cousins ready to mate. Birds migrate in flocks so they are able to keep track of each other. Antarctic penguins go south for the winter, which is odd since that means toward the South Pole and warmer weather. Most of the year they live on the ice sheet, but they march off, each troop to its own nesting ground, where undetectable except with special equipment their own home earth lies buries beneath the ice, where they raised their chicks before the ice time. And so it goes.
And the instinct is there. Patrick Bateson placed Japanese quail in cages where they could approach quail of the opposite sex visible through windows and saw how much time a bird would spend near nest mates, kin and unrelated birds. They much preferred to seek birds which they most resembled but had not been brought up together with.
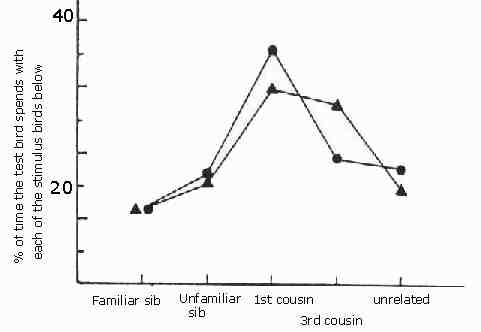
This graph after Figure 2 in Bateson (1982) shows the mean percentage time spent by adult Japanese quail near members of the opposite sex that were either familiar siblings, novel siblings, novel first cousins, novel third cousins, or novel unrelated birds. The chance level was 20%. Triangles are averages for 22 males, and circles means for 13 females. From Patrick Bateson Mate Choice (Cambridge University Press Cambridge 1983)
So the instinct to mate with cousins is real. Why, then, do we not? If one wants to make the sacrifice of raising children, one wants children and wants those children to be able to have children. Everyone knows that in the old days we married cousins and had lots of babies; now we do neither. That does not prove a causal relationship, but it does make a causal relationship the default assumption until powerful evidence proves the contrary. That’s only common sense. So mind as well as heart says marry kin.
My grandpa on my mother’s side used to say, “Don’t lose your head and your heart at the same time.” Well we have. I know not what evil spirit has possessed us, but we outbreed with what seems maniacal dedication. This troubles me greatly.
The next issue is of such importance that it possibly should have come first, but I wanted to start with data rather than pure abstraction. The question is why evolution should have done this to us? (I know a lot of people have trouble with the concept of evolution. Be of good cheer there is something in this issue to offend everybody.)
When I was a child the teaching of evolution was forbidden where I went to school. My third grade teacher amended this by leaving out a booklet which she never pointed out but which I read eagerly. It was a book on fossils. There were nifty picture of what an artist thought fossils looked like when alive, there was a timeline and there was a narrative describing changes over geological time. What struck me was that the most enduring life forms had been trilobites, which seemed to differ little from roaches, and dinosaurs.
In later years it would irritate me when I would read, as I often did, “Dinosaurs were fierce but died out because they weren’t adaptable.” That was in flagrant disregard of the fact that dinosaur diversity was amazing. They adapted to every environment I could think of. It seemed inescapable that the trilobites died out because something better came along and the same held for dinosaurs. I remember the first time when a teacher explained evolution. He spoke slowly and carefully. I thought, “Big deal. Why make such a point of it? Everybody knows that.”
What we were taught evolution depended on was, “Survival of the fittest.” That means survival of the survivors. It seemed to me that it should have been phrased, “Evolution is due to inheritable variation producing differential survival.”
But even my pet formulation here runs into difficulty. If big populations die out, isn’t that extinction of the fittest? It seems totally mad.
The problem is that a man named Alfred Russel Wallace became enamored of spiritualism … you know, summoning spirits of the dead. Poppycock, of course, but this brilliant man saw things that made him a believer. Even a believer should have told him, “Don’t trust these things. The spirits may mean you harm.” For a skeptic like me he was simply gullible.
He spoke out and it trashed hiis reputation. That is a tragedy since he was co-discoverer of evolution along with Charles Darwin. (Usually with a scientific theory I say something like “inventor,” but this is an awkward theory. There is no imaginable assembly of evidence that could make scientists reject evolution; they (we) would just say, “Ah, well evolution did that, too, don’t you see.” That which is not potentially disprovable is no scientific theory. I told you I was going to offend everybody.)
The reason that it is a bad thing that Darwin is idolized and not Russell is that Russell in fact understood it better. Darwin was just rich enough to publish his book at his own expense before Russell published. And what Russell saw was that in order for evolution to proceed past a certain point speciation must occur. Speciation is not “happenstance” as Darwin thought but is an enabling factor for the whole drill. If evolution is good, then speciation is good. If evolution is inevitable then speciation is inevitable.
The inevitability of speciation is the reason mechanisms developed to limit mating pool size. This will be easier to understand if I make reference to chromosomes. Most chromosomes exist in cell nuclei in pairs, one inherited from the father and one from the mother.
Consider a valley with 1,000 animals, say mice. One mouse has a particular normal chromosome.

It replicates and the two copies wind up in two offspring. These are as alike as two chromosomes can get to be.


One mouse scurries across the valley, glacier splits the valley in two. The glacier remains for two thousand mouse generations. The F2,000 mouse from the far side of the valley returns and mates with an F2,000 mouse from the near side. But they cannot have normal fertile offspring. There has been speciation.
Now, instead of a glacier, the mice mate at random throughout the valley, the population being constant at 1,000. Since there are 2,000 copies of the chromosome it takes on average 2,000 generations before F2,000 mates with F2,000. The offspring are not fertile. Since this is true of every part of every chromosome in every mouse, the population dies. (Often this graphic does not transfer well. If it looks like a mess, ignore it. The text should suffice.)
 .......................
 ........................................
 .................
...F1 ................... F1 ......... ........................ F1 ......................F1
G
l
a
c
i
e
r..............
 ..........
 ..
.. ..............................................
 .....................
 .........................
 ............................................
 .................
F2,000 F2,000 F2,000 F2,000
Obviously this is an event that evolution will not tolerate; neither an intelligent designer nor a really stupid designer for that matter. So a preventive mechanism must be in place that requires a couple to share ancestors over the previous 10 generations. Otherwise there will be an eventual population crash.
That is why the mechanisms developed. One or more had to.
The next issue is what earthly mechanism can be at work here? It has to be something that is manifested over multiple generations yet it happens too fast for DNA mutations to be responsible. In order to answer that question we must look, as promised, at more computer simulations. We shall compare what happens with intense inbreeding under the condition where a population is restricted by pre-zygotic outbreeding fertility depression and where a population is restricted by post-zygotic outbreeding fertility depression.
Computer simulation of a population restricted by pre-zygotic outbreeding depression. Average over 10 repeats. Number of offspring in generation 1,000 is on the vertical axis, size of population is on the horizontal axis.
As the population gets smaller, and average kinship of course greater, the number of offspring increases. There is no inbreeding fertility depression produced by the pre-zygotic mechanism. This is entirely consistent with the Iceland study where we saw no inbreeding depression in the first generation.
Computer simulation of a population restricted by post-zygotic outbreeding depression. Average over 10 repeats. Number of offspring in generation 1,000 is on the vertical axis, size of population is on the horizontal axis.
This time there is fertility depression when the population is very small and consanguinity very high. This is to be expected. We saw it in the Iceland study when we looked at grandchildren.
Why would there be inbreeding depression otherwise? It seems hard to believe that a mechanism develop the only effect of which was to eliminate a population when it fell on hard times. Of course Genetic Diversity tends to be the darling phrase these days. It’s supposed to be a Good Thing. Certainly it has its advantages, but not at such a terrible price. Then there is the observation that with increasing consanguinity there is an increased chance of deleterious genes that are harmless in the heterozygous state but destructive in the homozygous state finding their way into the same animal twice. But such genes as are known to act that way are rare. Inbreeding depression is predictable. So that explanation won’t wash. On top of that as inbred generation follows inbred generation things get worse. If it were a matter of two copies of bad genes, inbreeding depression should wane over successive generations as the bad genes were expressed and eliminated.
But there is a perfectly logical reason for there to be fertility depression from outbreeding as I pointed out earlier. So inbreeding depression is a side effect of the outbreeding fertility restriction mechanism. Find the mechanism for inbreeding depression and voila you have the mechanism for post-zygotic outbreeding depression.
And it has been found. But first we need to go over a word I haven’t used so far. It is “epigenetic.” Generally we think of things that are inherited as “genes,” and many are. A gene consists of DNA that contains information that is translated into the structure of a protein. Proteins have highly specific structures and perform a host of chores for living things. Anything that is inherited that does not match the understanding of “gene” but has a biological effect is referred to as “epigenetic.” So it is a garbage can definition. Generally it means something that controls the way one or more genes are expressed. Of the many mechanisms that potentially do that, the one I read about most commonly is “methylation.” A methyl group is just a carbon atom with three hydrogen atoms bound to it and another bond that is attached to another atom or combination of atoms. When a methyl group is attached to DNA at certain sites it depresses the function of the related gene. Ethyl groups tend to enhance function, but that is not our subject.
Inbreeding depression was induced in a kind of plant. (Elizabeth Pennisi Epigenetics Linked to Inbreeding Depression SCIENCE vol. 333 no. 6049 September 16, 2011 page 1563 reviewing work by a team led by Philippine Vergeer, Hugens Building, Room HG 01.132, Radboud University Nijmegen, Molecular Ecology, Heyendaalseweg 135, 6525 AJ Nijmegen, The Netherlands p.vergeer@science.ru.nl ) What they found was that if the plants that had been subjected to inbreeding to the point of inbreeding depression were sprouted in an environment with a demethylating agent (removing the most common epigenetic effects) the deleterious effect of the inbreeding was completely removed.
So there it is. In plants, and until somebody does more studies of other plants and animals we must suspect that generally, inbreeding depression has nothing to do with genes. It is epigenetic. Epigenetic effects, that is to say the methylation of DNA, can be carried from generation to generation but it changes far faster than DNA mutations. So this is at least one of our mechanisms for outbreeding fertility depression; it is a post-zygotic mechanism.
And then one final issue: if birth rates in the developed world are steady, is there any evidence that a fertility crash is sneaking up on us? Sure. Here is the experience of Sweden between 1955 and 2005 with the births per woman on the horizontal axis and age at first marriage on the vertical axis.
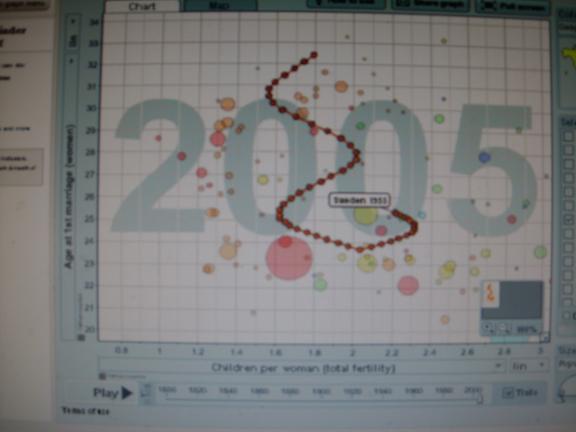
Taken from gapminder.com Each circle is a year. 1955 is where the label is. From there the trace wanders a bit but then fertility drops below 2 children per woman where it mostly remains. It levels off, although it is not constant. No sooner has the fall gone below replacement than the age at first marriage begins to rise. This is typical for developed countries.
We must assume that age at first marriage is about the same as average age for first child, although by no means are all babies in Sweden born to married couples nor do all married couples have babies.
There is a puzzle here. From prior considerations we suspect that pre-zygotic outbreeding depression has limited power. It can only produce really high grade infertility if it works in combination with post-zygotic outbreeding depression. And from comparing simulations of pre- and post-zygotic fertility depression it appears that post-zygotic depression undergoes its changes faster than pre-zygotic depression. And we are forced to believe that worldwide there is a very strong tendency for outbreeding.
This tendency must have gained currency at some time for any one country or social group. That time is easily seen if one goes to the gapminder site and arranges, as I did for this graph, to put fertility on the horizontal axis and age at first marriage for women on the vertical axis. Run all the countries available for as far back as there is data. What you will see just about every time is that the fertility and age at first numbers bounce around unpredictably (except for places where vintage statistics are sparse, where they tend to be locked in place for substantial periods of time) until there is a sudden lurch toward lower fertility. This usually proceeds rapidly to a level below replacement and then it stops. That lurch I presume is when the population as a whole began outbreeding.
That is what we would expect of pre-zygotic infertility. It starts out right away but runs its course without producing extreme infertility. The birth rate generally stays above one child per woman.
The system is elegantly tuned. There is almost no delay between the end of the fall in fertility attributable to a pre-zygotic mechanism and the beginning of the rise in average age at first marriage for women.
That rise, I strongly suspect, is due to a post-zygotic mechanism. The mechanism may be changing the women or it may be changing the men available to the women. So we are watching the pre-zygotic mechanism run its course and then the post-zygotic mechanism cutting in. And of course the post-zygotic mechanism gets its start a generation after the pre-zygotic mechanism starts.
It is hard to see how this could produce a double peaked curve as we saw so frequently. That seems to depend on the post-zygotic mechanism running its cycle faster. Currently the post-zygotic mechanism is playing catch up.
Alas it seems to be the case that we cannot expect a two peaked curve. Go back and look at the mouse data. For most the really big plagues, which probably involve a lot of different local mating pools, there is only one peak. That seems to be what we are looking at. The rise in age at first marriage will probably continue. The birth rate will probably remain pretty stable as the older women make up for lost time and have more children than their age mates of a generation before. But that process cannot go on indefinitely. Unless something very surprising happens they will at last reach an age when they are unable to maintain even the inadequate birth rate we see now. Depending on how homogenous a society is, and they do seem to be pretty homogenous with regards to when they start their fertility decline (remember it begins as a lurch) the end could come quickly.
There still might be time to save much. The problem is deciding to try.
New Evidence:
This is a paper Dr. Lewis and I had published in 2013. The heart of it has been presented above so I shall not paste in the whole paper. If you are interested in a copy and cannot turn one up email me at info@nobabies.net.
Fluctuation of fertility with number in a real insect population and a
virtual population
M.L. Herbert & M.G. Lewis
African Entomology 21(1): 119–125 (2013)
More New Evidence:
Some people counted voles in Europe and followed their population size. Have a look and see whether they look like our data on fruit flies:
Thomas Cornulier et al. Europe-Wide Dampening of Population Cycles in Keystone Herbivores SCIENCE vol. 340 no. 6128 April 5, 2013. Only part of the data shown.
Sorry about the resolution, but bear with me and confine your attention to the dark line in the graph in the top left hand corner. The dark line is annual spring counts of voles taken in Sweden from 1970 to 2010. The cycles occur at a rate of three per ten year interval. With our flies we reckoned the time of the cycle from peak to peak was about 5 months or five generations of flies the way we had it set up. If we apply that to three cycles in ten years we get about a 40 month cycle. At five generations per cycle that would suggest that voles have about an 8 month generation time. You can decide whether this is reasonable.
More New Evidence:
More on methylation:
For years now I have pondered epigenetics and read what came my way. I thought it to be important. I still do. But it was like standing in a valley with low clouds. I could see the edge of the valley but not upward. Then this article came up. (Robert J. Schmitz et al Patterns of Population Epigenetic Diversity NATURE vol. 495 no. 7440 March 14, 2013 page 193 and Steven Eichten and Justin Borevitz Methylation’s Mark on Inheritance page 181 in the same issue) Lo the mountains appear. They are not yet climbed. And I knew there had to be mountains out there somewhere, but getting a glimpse is a big help.
At the bottom there are genes written in the language of DNA. Those genes can be converted into the relevant proteins by a mechanism that involves among other things different sorts of RNA. (RNA is ribonucleic acid. DNA is deoxyribonucleic acid. If that’s not much help, then “ribose” is a kind of sugar that the acid contains, DNA is found in the nucleus of a cell while RNA is both in the nucleus and the surrounding cytoplasm and an acid is a chemical class that is sort of the opposite of a base.) Information in the DNA is encoded in a series of bases. They are cytosine, guanine, adenine and thymine (abbreviated C, G, A and T and for our purposes in a bit H will stand for anything other than G.) The bases are situated in pairs C with G and A with T within the double helix structure we are all familiar with. That’s right, the information is tucked away inside, where it’s got to be harder to access. And then the whole thing is wrapped around a core of protein of a class called “histone.” I can’t figure out why the whole thing doesn’t snarl up like a telephone cord … oh … You never heard of a telephone cord. It was this stuff we used to tie up dinosaurs.
The sequence of the bases is what encodes the information for making a protein, and it does a lot of other things, too. A sequence that encodes a protein can reasonably be called a “gene.” Progress is being made understanding the rest.
So far you have a source of proteins. I think of them as tools. But owning a machine shop or a woodshop is not sufficient for making something. You need a plan. You need to know when to use the tools. Anything, not itself a gene, that controls how genes are turned on and off is epigenetic. There are various epigenetic mechanisms but one that is important is the process of “methylation.” A methyl group is a carbon atom with three bonds to hydrogen atoms and its fourth bond attached to something else. If that fourth thing is another hydrogen atom, then it is “methane” not a methyl group. When a gene has methyl groups attached to it then its function is usually suppressed to a degree particularly if there is a string of such attachments.
That is my best thumbnail description. If you need to know for sure, consult a proper source. If you know me to be wrong in some detail, forgive me and tell me. But it was together pretty much my understanding of the mechanism. And then the clouds rose a bit as I read the article.
One question is, “All right. So just where is this methyl group attached to the gene? Is it the bases, the outside helix, the histone core or something else?” As it turns out, there is more than one possibility, but basically a methyl group attaches to a base C; just where on those bases the methyl groups attach I do not know, but I am sure somebody does.
There are three classes of methyl attachment. The methyl group can attach to CG, CHG and CHH. These are all produced differently and inherited differently; they are different systems and they are mediated by some sorts of RNA molecules. In other words this is, if not a purpose built set of mechanism, it is a set of mechanisms that evolved in the fulfillment of some vital function.
Methyl groups are, at least to a degree, inherited. This is a key interest in the Schmitz paper and an analysis was done showing how the pattern of methylation varies among different geographical areas opening up the promise that the differences will be useful in figuring out which populations are more closely related to which. There is plenty to work with. The number of sporadic methylations generally number in the hundreds of thousands and they change from generation to generation much more than DNA base pair sequence changes.
So looking forward I strongly suspect that these very methyl groups are at the heart of the mechanism that relates kinship with fertility. Someday we will know exactly which ones.
More New Evidence:
I thought they were jennies:
Rather more frequently than is good for my ego, I find my vast fund of ignorance to be greater than I had thought. For instance I thought that a cross between a stallion and a female donkey was a mule and a cross between a mare and a male donkey was a jenny. It turns out that a jenny is a female donkey. The result of the cross reciprocal to the one that produces a mule is a hinny. Anyway, it’s as sterile as a mule.
But ho, there is new information. (LMZ Of Hinnies and Mules SCIENCE vol. 350 no. 6140 June 28, 2013 page 1500 reviewing Proc. Natl. Acad. Sci. U.S.A. 110, 10.1973/pnas.1308998110 (2013)) What they have found is a number of genes associated with the development of the placenta (the little pancake shaped or maybe mud pie shaped organ that lets the fetus’s circulation exchange key materials with the mother’s circulation) in horses and donkeys and in the hinny and mule those genes are silenced because there is a different methylation pattern between horses and donkeys, at least so I read it.
So there you have it, folks. I have long said that the infertility of outbreeding is due to an epigenetic process, such as methylation patterns, and probably due to more than one process. And now an epigenetic process has been implicated in infertility in mammals. What can I say? Can we all go home now? Doesn’t that prove it?
More New Evidence:
The effect of epigenetic changes on fertility has been documented in inbred plants. (Elizabeth Pennisi Epigenetics Linked to Inbreeding Depression SCIENCE vol. 333 no. 6049 September 16, 2011 page 1563 reviewing work by a team led by Philippine Vergeer, Hugens Building, Room HG 01.132, Radboud University Nijmegen, Molecular Ecology, Heyendaalseweg 135, 6525 AJ Nijmegen, The Netherlands p.vergeer@science.ru.nl ) What they found was that if plants that had been subjected to inbreeding to the point of inbreeding depression were sprouted in an environment with a demethylating agent (removing the most common epigenetic effects) the deleterious effect of the inbreeding was completely removed. Well if inbreeding depression is an epigenetic effect, why not outbreeding depression, and if in plants, why not humans?
Illustration from the article cited above.
Since inbreeding depression is an inescapable consequence of outbreeding depression in a post-zygotic system according to my computer simulations (which I gave you earlier), this is strong evidence that outbreeding depression in humans is in fact due to mismatch of our methylation patterns.
More New Evidence:
Folate and sperm:
There is a cloud on her horizon no bigger than a man’s hand. (Poisoned Inheritance ECONOMIST vol. 409 no. 8866 December 14, 2013 page 85 reviewing work by Sarah Kimmins and colleagues at McGill University, Montreal published in Nature Communications.) Where it goes from here is anybody’s guess but I am optimistic for a downpour.
It has long been known that if mothers are denied adequate folic acid in their diet during early pregnancy their babies have an increased chance of birth defects. What has now been shown through excellent work is that if male rats are denied folic acid then their fertility is reduced, their offspring have a greater incidence of birth defects and as the pups go on in life they have an increased likelihood of cancer, diabetes, autism and schizophrenia. (Of course a rat can’t tell you what it’s hallucinations are, but you can observe things like working memory, selective attention, “set shifting,” social interaction and startle inhibition: http://www.ncbi.nlm.nih.gov/pmc/articles/PMC1764543/ ) These things seem to be on the rise in rich countries although folate deficiency is presumably not; they add folic acid to things like bread.
Say, “Folate,” and I’ll think, “Affects methylation of DNA and has epigenetic effects,” and say, “That’s my game.”
It’s not yet clear whether men should take folate supplements before attempting to become fathers. The relevant methylation of their sperm could happen just before ejaculation or it could happen during early embryonic development. I’m sure the answer will be coming out of Montreal pretty soon. The workers there have diligently run down the site where methylation of the sperm takes place, and sure enough some of them are implicated in the diseases in question. What I doubt they ask (although I’ll suggest they ask, my letter being included below) is whether the problem is really always just a lack of methylation or is it a mismatch between the maternal methylation pattern and the paternal. It might be indeed, since there is certainly a steadily increasing mismatch between methylation patterns of couples in our stampede to outbreed.
Yet even one more new evidence:
(Playing Kissy with the relatives SCIENCE vol. 342 no. 6163 December 6, 2013 page 1147 reviewing Nat. Struct. Mol. Biol. 10.1038/nsmb.2699 (2013) shows that bacteria also have a preference for mating with kin when, indeed, they do mate.
Some old evidence I’d lost track of:
. 3,000 species across a variety of taxa were studied by Bazin et al (Population Size Does Not Influence Mitochondrial Genetic Diversity in Animals. Eris Bazin, Sylvain Glémin, Nicolas Galtier SCIENCE VOL: 312 570 28 APRIL 2006.) Although they reckoned that real population sizes varied over several orders of magnitude, overall they found little (factor of about 10 and simpler seeming forms with larger populations) variation in nuclear DNA over multiple taxa (bottom line), and none at all in mitochondrial DNA (upper line). They suggest multiple selective sweeps. I think it would be reasonable to suggest that population sizes don’t actually very by several orders of magnitude; they all have to stay about the same size for the same reason.
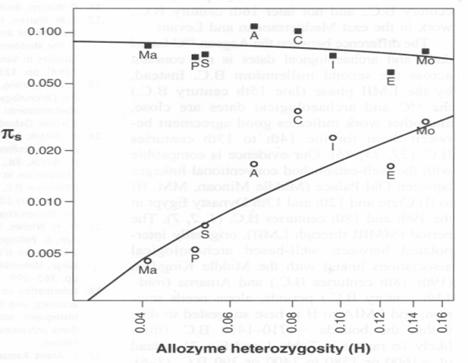
Population Size Does Not Influence Mitochondrial Genetic Diversity in Animals. Eris Bazin, Sylvain Glémin, Nicolas Galtier SCIENCE VOL: 312 570 28 APRIL 2006.
More old evidence:
“The article (Lundström et al. Biological Basis of the Third-Cousin Crush SCIENCE vol. 320 no. 5880 May 30, 2010 page 1160-1161) notes the results of the study of Iceland genealogies by Helgason et al. and explains that the mechanism whereby nearer kin couples are more fertile is already probably known. It turns out to be based on something called the major histocompatibility complex. The term arose when people were trying to work out what animals had tissues that were compatible in transplant into other animals. However it has also been shown to be important in mating choice, presumably because of similar smells of people with differences in their histocompatibility complexes.”
Well at least they are looking, eh?
There have been 54 visitors over the past month.
Home page.