Most dreaded terror.

https://www.google.com/search?hl=en&tbm=isch&source=hp&biw=1144&bih=550&ei=Cto2WqffDKHZjwTHhJC4Ag&q=golden+eagle&oq=golden+ea&gs_l=img.1.0.0l10.3546.7387.0.12686.9.7.0.2.2.0.113.701.4j3.7.0....0...1ac.1.64.img..0.9.701....0.yLmWTHVr1LA#imgrc=FydfOeIiBZmupM:
downloaded 12/17/17 For the whole story, go to nobabies.net and start reading summaries, papers and the source code.
Chat 1 Incest does not work the way they say it does.
- The title is of course a pun. This issue is an error, a fault in thinking threatening our very existence.
- Let me give my non-standard and deliberately inflammatory definition of a baby. When a sperm touches an egg, that moment defines the DNA, the epigenetic markers and intracellular machinery to make an individual. If you have done something that prevents that individual from developing enough to say – or indicate – “I am not a baby,” you have killed a baby.
- I hold it as obvious that a woman has total refusal rights over what becomes of her ova, and a man has the same rights over his sperm. However once there is a baby, then everybody in the world has a stake in what happens, and a vital stake: no babies, no humans.
- Maybe an easy place to start is incest. Nobody likes incest. Bateson showed that in quail the birds are less attracted to near kin and to “unrelated” birds they grew up with. Incest produces reduced fertility – kills babies – and does some other unpleasant things. So what is the mechanism?
- The usual explanation is that the genes that perform so many functions can be damage by a mutation that shuts the gene down. Since there are 22 pairs of chromosomes (ignoring sex chromosomes), one from each parent, that hold the genes as well as much else. Two ruined genes in the same individual are very bad indeed.
- In a small population, with closely related couples, two ruined genes are more likely (than in a large population) to get together and produce a bad outcome.
- This accumulates over multiple generations until the line dies out.
- Points five and six are a distraction that keep you from looking closely at point seven. So let us do just that.
- Imagine a population of just 4, 2 males and 2 females. Each of the 4 chromosomes held by the males can be matched at random with any of the 4 held by females. You get one of each kind of chromosome from each pattern, the other being discarded. So the possibilities are:
- Females
Males
Everybody gets two good chromosomes.
11.Now we assume there are 2 bad chromosomes, one among the males and one among the females. These can be eliminated either at random by genetic drift or non-randomly by selection:
Females
Males
Starting with
genetic drift, each generation for every chromosome that is passed on, one is eliminated at random; it’s more complicated, but let’s go with the simplification. Ignoring for now the effects of the chromosomes, each bad one has a fifty/fifty chance of not being eliminated. That means one of the two in the first generation and the other with a fifty/fifty chance each generation gets eliminated after 2 more generations on average for a total of three generations.
12. Now look at a population twice as big, four females and four males with eight chromosomes and 4 bad mutations total.
Females
|
G |
G |
B |
G |
G |
B |
G |
G |
G |
|
|
|
|
|
|
|
|
B |
|
|
|
|
|
|
|
|
G |
|
|
|
|
|
|
|
|
G |
|
|
|
|
|
|
|
|
B |
|
|
|
|
|
|
|
|
G |
|
|
|
|
|
|
|
|
G |
|
|
|
|
|
|
|
|
Males
G (Sorry the grid doesn’t come down this far.)
So now we have four bad genes to get rid of at 50% each. It’s going to take longer; half are eliminated in the first generation, leaving two, and you have two left, which again will take 3 generations for a total of 4 generations.
13. This is called genetic drift. A small population will purge itself of a rare mutation faster than will a large one. So much for genetic drift making incest such a bad thing.
14. But the question was what happens to bad genes that is due to their (lack of) function.
Looking at the small population again we have:
Females
Males
The X indicates a non-viable baby. We hold the population constant. Working down from the bad chromosome from the female, there is a one in four chance of matching the bad male chromosome. That takes on average 4 generations.
15. After 4 generations, and holding the population size constant, the population looks like this:
Females
Males
We are happy.
16. Now we do the same thing with the larger population: Females
|
G |
G |
B |
G |
G |
B |
G |
G |
G |
|
|
|
|
|
|
|
|
B |
|
|
X |
|
|
X |
|
|
G |
|
|
|
|
|
|
|
|
G |
|
|
|
|
|
|
|
|
B |
|
|
X |
|
|
X |
|
|
G |
|
|
|
|
|
|
|
|
G |
|
|
|
|
|
|
|
|
Males
G (There it is again.)
17. The female bad gene in red has 2 chances out of 8 of matching a bad male gene, which is a one in four chance and it should take 4 generations to remove this pair of bad genes and the same for the other pair for a total of 2 generations to remove a pair of bad genes. But, except in the unlikely event of getting two matches at the same time, we are left with two more bad genes. Females
|
G |
G |
G |
G |
G |
B |
G |
G |
G |
|
|
|
|
|
|
|
|
B |
|
|
|
|
|
|
|
|
G |
|
|
|
|
|
|
|
|
G |
|
|
|
|
|
|
|
|
B |
|
|
|
|
|
X |
|
|
G |
|
|
|
|
|
|
|
|
G |
|
|
|
|
|
|
|
|
Males
G
18. The remaining female bad gene will have a one in 8 chance of matching the bad male gene. That will take another 8 generations. So on average it will take 10 generations to remove the bad genes from the large population compared with 4 for the small population. Given that the mutation rate per individual is identical in the two populations, it is the smaller population that does the better job of dealing with bad mutations, whether by genetic drift or by selection against those mutations.
19. There are many complicating factors and differences from the classical pattern, but the bottom line is clear. The idea that bad mutations accumulate in small populations is just not true.
20. That is not to say incest is not bad. It’s real. It kills babies. But the mechanism simply is not genes. It will take a long time, but I hope some day to lay out the mechanism for you.
21. Don’t think, “Oh I’m not worried about inbreeding. We just avoid it.” But if you don’t know the mechanism you are in no position to avoid the same process. My mother’s attitude was always, “It’s Ok to be scared. It’s Ok to run away. Never run scared.” They say that one way lions hunt is for a female to get a male to hide in the grass. She then finds a juicy antelope and approaches it just enough to be annoying. The antelope edges away and thus is herded toward the male. The male gets worried about all those hooves and horns and eventually stands up and roars. The antelope bolts only to be pulled down by the lioness.
If I might: Never run scared; always think scared.
22. And you must understand the mechanism by which incest kills babies or you have no better chance than the antelope of avoiding it.
Most Dreaded Terror 2 speciation
https://www.youtube.com/watch?v=hVATVF-816U
It is the 19th of February 2018 and I am excited to be explaining something that has been doing us harm for such a long time I scarcely believe it: the mechanism by which inbreeding kills babies and the same mechanism harms us in other ways.
Last lesson (the first lesson) explained that inbreeding does not do its harm by the effect of genes. Were that the case, it would be no great problem. It is Something Else that is inherited but is not genes. And that Something Else is the mechanism that is the point of this whole series. I shall attempt to keep this light because you will need all the cheer and courage you have to see it through and understand it.
- Consider an animal and a niche.
A
The niche, sort of like a crude house here, provides the animal with food, shelter, air, water and whatever else it need to survive and reproduce. This is not an individual animal but a population that mate each other and carry on generation after generation. There will be variation within the population – mutations and so forth. The variant may nudge the animal toward the niche or in some other direction. It is inefficient, but over time the animal population is pushed toward the niche. This is called selection.
- Now the animal is in the niche. Any variation is tested against how well it lets the animal do in the niche. This is now more efficient. The animal is unlikely to be dislodged from its niche by an outsider, here suggested in orange.
A A
- Now suppose there is a new niche, and there are two animals, either of which might be able to change in a way that permits it to exploit the new niche.
A A
The first that gets there has an advantage. So SELECTION IS A RACE.
- While the two animals are competing to reach the niche first, one may divide itself into two species. This is called speciation. Here the new species is shown in purple; that and the black letter are derived from the original black.
A A A
Now the black A animal can compete for the new niche while the purple A animal stays in the old niche. In fact the black A may get a bit of a boost because, its old niche being filled, it is not held back by selection in that direction, while the orange A animal is drawn in the direction of the new niche as well as the one it already occupied. So SPECIATION IS A RACE. Of course the animal does not knowingly exert itself in this race. Being around animals one notices them engaged in goal oriented, purposeful, conscious, strenuous behavior. But in this race there is no conscious strategy.
- I am not aware of any general consensus regarding how long speciation takes. It can happen very fast, for instance if there has been hybridization – the combination of two species – but generally I take two thousand generations as plausible. That’s only a guess, and you can take any number you like, but don’t go overboard and say two million or we shall have words.
- Imagine a niche in a valley:
https://www.google.com/search?hl=en&biw=1144&bih=550&tbm=isch&sa=1&ei=Hdw2Wu_jFsTIjwScv6zAAw&q=valley&oq=valey&gs_l=psy-ab.1.0.0i10k1j0l7j0i10k1l2.11692.16109.0.18725.4.4.0.0.0.0.87.326.4.4.0....0...1c.1.64.psy-ab..0.4.322...0i67k1.0.u82qJtoRNMI#imgrc=czQxN7dAhVhxGM: downloaded 12/17/17
An animal roams the valley and finds it an adequate niche. There are two individual animals in the population that are siblings, as closely related as they can be, a and a’. One goes across to the far side of the valley. Then it gets cold, and a glacier forms, splitting the valley. The animals cannot cross the glacier.
Two thousand generations pass. In that time speciation has developed. The descendants are a and a’, which are now different species. If the glacier melts, they cannot mate and have fertile offspring.
- Now suppose instead of a glacier it gets warm.
The population rises to well over a thousand. a and a’can get to each other, but that is not likely to happen right away. As you know in humans there are 46 chromosomes, the parts of the cell involved in speciation, of which 22 pairs are autosomes, structurally the same. For a chromosome from a to wind up in the same animal as a chromosome from a’ will take more than 2,000 generations. By then the descendants are a and a’ which are different species. They cannot have fertile offspring. Since this is true of every member of the population, the whole population dies out.
- That is what you get if you restrict your thinking so that only genes are inherited. Since it is obvious that there are any number of species with more than a thousand members, something else must be at work. That thing is the mechanism we are looking for. Something must be stabilizing populations so they have robust resistance either to rising toward a thousand or falling toward zero, which of course one would expect if the members of the population did not change even in the face of changes in the environment or in their own makeup.
- We have very few clues:
- There is something that stabilizes population size.
- It is inherited.
- It is not a matter of genes.
There are going to be more clues. If you want to cut to chase, go to nobabies.net and read the summaries, the papers and dig into the “source code” postings.
Most Dreaded Terror 3 Sibly
https://www.youtube.com/watch?v=hVATVF-816U
It is 21st of February 2018, and you cannot possibly imagine how excited I am until some day you get to the end and understand it. Then you may wonder why I am not running down the street screaming.
- We are in pursuit of whatever makes inbreeding kill babies, because it does not stop there. We have seen that the mechanism is inherited but not genetic and it stabilizes a population at some moderate size, neither too small to survive nor too large. It is time for some data.
- A team led by a man named Richard Sibly wrote “On the Regulation of Populations of Mammals, Birds, Fish and Insects,” Richard M. Sibly, Daniel Barker, Michael C. Denham, Jim Hope and Mark Pagel SCIENCE vol. 309 July 22, 2005 page 609. They collected every paper published before 2005 that was about serial field counts of wild animals. If you went into a field periodically and counted rabbits and published your results your paper was analyzed.
- In all they found 1,700 studies they thought suitable and discussed what as found. If a study ran for 5 or 10 years. That would be something like ten thousand years of data collected by professionals. That is a lot of work. The result is not going to go away.
- Sibly did not publish an overall result, but he looked at the collection and gave a typical example. I have made bold to do a sketch of it here:
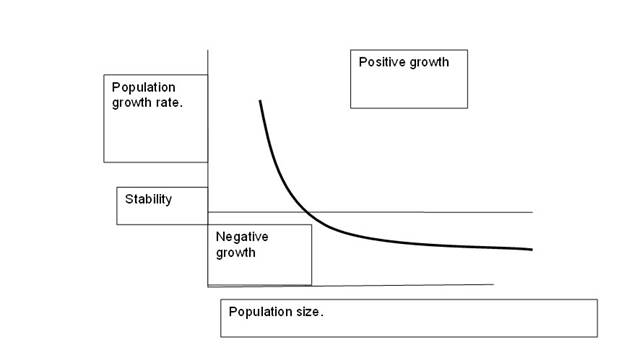
Feast your mind for a moment on the idea that holds it together. The horizontal axis is easy. It’s just the animals counted. The vertical axis is the population growth rate. You might be able to contrive an explanation based on predators or disease, but over the next few talks that will not hold up. The cause is a difference in fertility.
- The line is incomplete. There is no evidence for inbreeding depression. The line should be falling toward the left very steeply at the red arrow here.
We agree that inbreeding depression happens. Sibly says he did not observe it in the wild, but he excluded from analysis populations that went extinct. So I think it more than fair to say that there is an undemonstrated falloff in fertility at very low population sizes.
- The important point is indicated with a purple arrow here:
Here there is neither positive nor negative growth. For humans that is ideal. Opinions may vary on just how many people we want on the planet, but there can be no disagreement on the right growth rate. Negative growth eventually leads to extinction. Positive growth eventually leads to the kind of environmental and resource exhaustion that we have been warned of so much.
- Crucially, at smaller population sizes than the zero growth point the fertility rises rapidly. At smaller sizes the fertility falls slowly. This is what we needed to see. The curve stabilizes the population size at some moderate value. So long as the displacement from the zero point is not too great the population will return to that point.
- If it were possible to divide human kind into a number of mutually exclusive societies, each the size of the population at this point, and if they were to reach equilibrium then we would have a stable world population. Just what that population size should be is not known. It might be possible to work it out from the Icelandic genealogies such as we shall be looking at next. How it could be set up in a way that left everybody happy or even whether there will ever be the will to try are questions that are as baffling as they are important.
Most Dreaded Terror 4 Iceland
https://www.youtube.com/watch?v=hVATVF-816U
It is 25th of February 2018, and again you cannot possibly imagine how excited I am until some day you get to the end and understand it. And again, I am worried that I might make this so light as to be silly or so dark you can never make it through.
- We are in pursuit of whatever makes inbreeding kill babies, because it does not stop there. We have seen that the mechanism is inherited but not genetic and it stabilizes a population at some moderate size, neither too small to survive nor too large. We have seen the Sibly curve, which is supported by massive amounts of data, which shows the mechanism in effect, stabilizing populations of mammals, birds, fish and insects. It would be understandable for a prudent person so say, “Ah, but those are all dumb animals. We humans choose whether to reproduce.” And to a degree we can, but we need to look at some human data.
- A team led by a man named Helgason looked at data from the enormous Icelandic genealogy. Then he compared the kinship of couples with how many children they had. This is what he got:
“An Association between Kinship and Fertility of Human couples,” Helgeson et al. Science vol. 319 February 8, 2004 page 813.
Gaze at it a bit and then let me tell you what they have done. They chose a large number of couples. They recorded the number of children each pair had. They calculated the kinship of the couples by going back ten generations and counting how many ancestors they shared in that generation. Then they calculated kinship in terms of say first cousin if they shared a quarter of the possible number of ancestors, second cousin if they shared an eighth and so forth. Obviously this is not the way we ordinarily recon kinship. I’m sure very few can name all their ancestors for 10 generations back. Then they lumped the data so that every couple between say third cousin and fourth cousin was labeled “fourth cousin or closer.” I might have suggested “third cousin once removed.”
Then they took the average number of children in each fraction and “normalized” it, which means they compared it with the average across the country for that year. Thus zero means the same degree of fertility as the Icelandic average.
- We can immediately recognize the Sibly curve. Do not think for a second that humans are exempt. The effect is not enormous, going from roughly 10% below to 20% above the national mean, but the effect is clearly not trivial.
- Now look at the error bars. They are very tight. Those are ninety percent confidence limits. There cannot be much else determining fertility. Any factor other than kinship of the couple has to squeeze into that little interval. That includes choice. It will be more extreme when we look at the next generation.
- Before that, however, look at “eighth cousins or closer.” That is the most distant relationship they examine. Either they have thrown away data or ninth cousins are vanishingly rare or totally absent. That alone should give a prudent person a maximal warning.
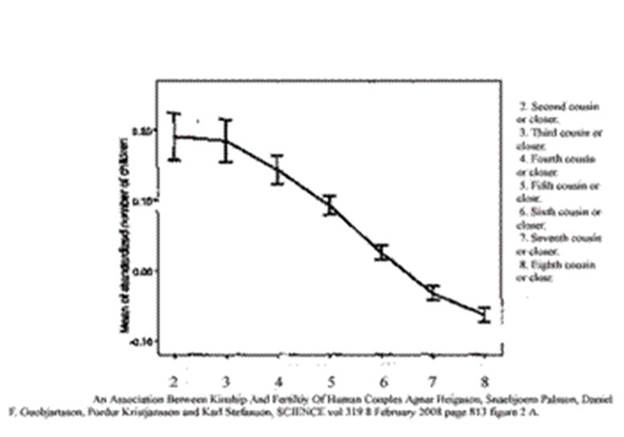
- Helgason’s team went further and looked at the next generation, the grandchildren:
An Association between Kinship and Fertility of Human Couples Agnar Helgason et al. SCIENCE vol. 329 no. 5864 February 8, 2008 page 813 – 816
Sorry, Dreamweaver and Word are at daggers drawn. Check the videoor Fritz's talk on population collapse, posted here June 5, 2017 under "Summaries" on nobabies.net home page
The axies are the same. Vertical axis ranges from about equal to the Iceland average to 15% above. Thus in only two generations the kinship choices can change fertility by about 40%. The horizontal axis is “second cousin or closer,” then “third cousin or closer” and so forth, but giving the degree of kinship numerically rather than using an altered form of usual usage.
- Notice that while “second cousins or closer” gave a maximum number of children, that does not give a maximum number of grandchildren. To my eye third cousins should have the most grandchildren. Don’t start muttering “inbreeding depression” just yet. First cousin once removed still produces more grandchildren than does anything more distant than about 6th cousin which is close to “zero” or the Iceland average, and which I would guess to be reasonably close to replacement.
- Since there is no reason to expect a couple to have exactly the same kinship as their respective parents, much of the variation in the number of children a couple might have (remember the 90% confidence limits) must be due to the kinship of the parents. On the face of it fertility in that country is due to kinship issues AND NOTHING ELSE. Maybe you can choose your mate, but that choice having been made the number of children cannot be changed.
- We shall see in a later video that people and mice mate for status and not attraction.
- We shall also see, later, that folic acid supplement can affect fertility, but for now the evidence at hand only supports the concept that kinship issues absolutely determine fertility.
Most Dreaded Terror 5 Denmark

https://www.google.com/search?hl=en&tbm=isch&source=hp&biw=1144&bih=550&ei=Rt02WuPBFIqpjwTiw46wCw&q=golden+eagle&oq=golden+e&gs_l=img.1.0.0l10.6800.18112.0.20870.8.6.0.2.2.0.77.434.6.6.0....0...1ac.1.64.img..0.8.436....0.JX5UDcWq7S0#imgrc=hPv420Jc5F3bIM: downloaded 12/17/17
It is 26 of Feb., 2018, and we are piling on the data. We are in pursuit of something that is inherited but not genetic and which is able to stabilize a population of animals so that it has a chance of not going extinct, but the same mechanism will kill babies, kill too many babies, if we are ignorant of how it works.
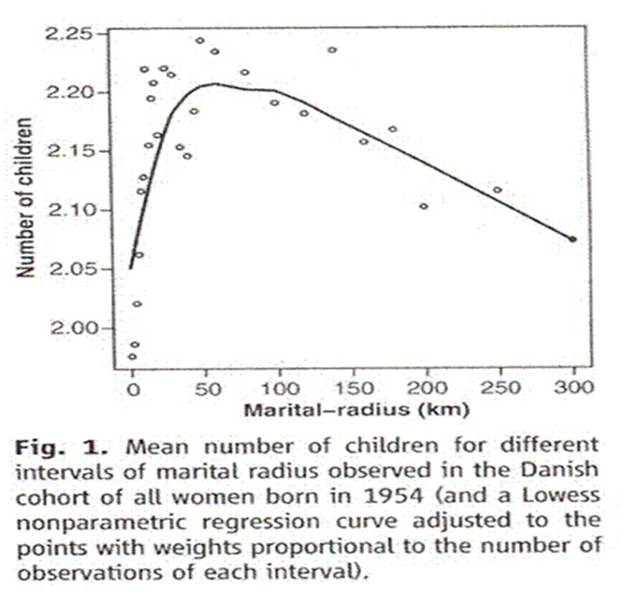
- The next data set comes from Denmark. Rodrigo Labouriau and António Amorim compared fertility in Denmark with something they call “marital radius” (how far apart a couple were born). This is what they found:
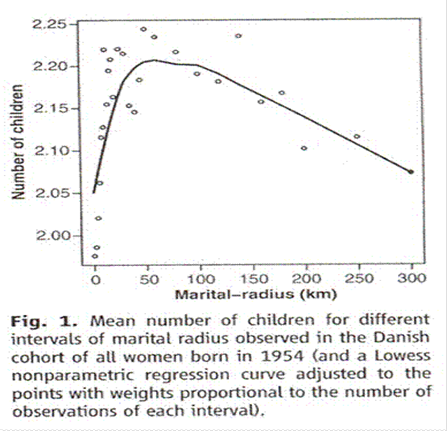
Comment on “An Association between Kinship and Fertility of Human Couples,” Rodrigo Labouriau and António Amorim, SCIENCE vol. 322 no. 5908 December 12, 2008 page 1634. For the whole story also see Human Fertility Increases with marital radius. Rodrigo Labouriau and António Amorim. GENETICS volume 178 January 2008 page 603.
- It looks a bit like the Sibly curve. At marital radius fifty kilometers or less we see the inbreeding depression we knew all along had to be there.
- At marital radius one hundred kilometers or greater there is a linear decrease in fertility as distance increases. Extrapolating a straight line is straight forward; eventually that line must reach zero. Is clear that if you heedlessly select mates from a great distance (marry very distant kin) for enough generations the population will die, while marrying closer kin would let the population continue to flourish. We already suspected as much from the Iceland data.
- There is a notch between fifty and one hundred kilometers. We will be seeing notches ad nauseum in data to be shown later. I am not clever enough to figure out whether this notch is the equivalent of all those others.
- The graph shows fertility compared with distance rather than area. To make it comparable with the Sibly curve as shown we would have to square the distances. This would pile numbers up on the left and stretch them out into the familiar curve on the right.
- As for choice, the team specifically compared education and income with fertility. They found that after you allow for kinship as measured by town size and marital radius there was no effect at all of these things on fertility. The only choice made is “at the altar” – choice of mate.
- As we shall see later, there is evidence that folic acid in standard clinical dosage can reduce fertility, too.
Most Dreaded Terror 6 UN numbers

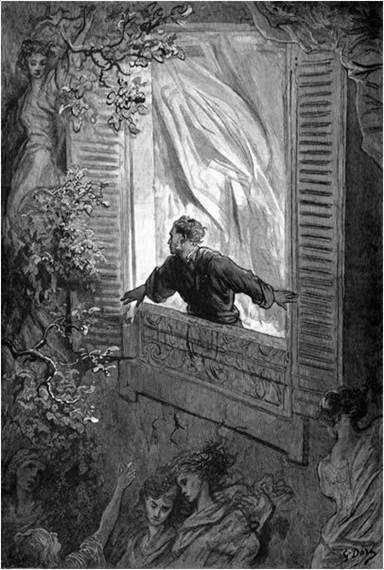
Dore “Raven”
https://hyperallergic.com/102457/rediscovering-the-dark-splendor-of-gustave-dore-with-edgar-allan-poe/ downloaded Feb 18, 2018
It is 1st of March 2018, and we are piling on the data. We are in pursuit of something that is inherited but not genetic and which is able to stabilize a population of animals, including humans, so that it has a chance of not going extinct, but the same mechanism will kill babies, all the babies, if we are ignorant of how it works. Now we shall look at UN numbers:
- The UN has accumulated data on the total fertility of countries and divided those countries into least developed, middle and most developed, thus.
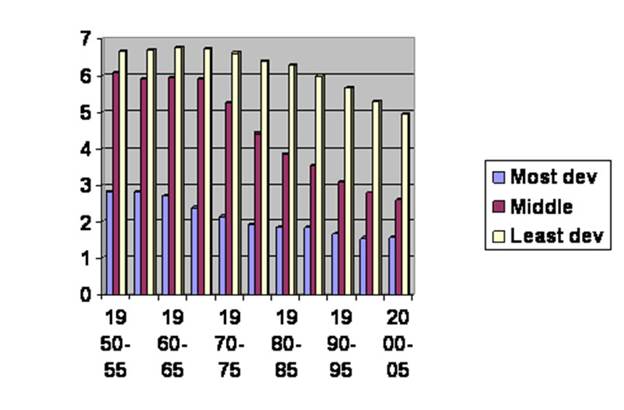
The number cover the fifty years into 2005. I am not exactly sure how they handled the fact that a country can become more developed or less developed relative to each other over time, whether they moved countries from one group to another group, but I doubt there was much of that. I took down their numbers and simply graphed them. Approch this graph with great care; do not leap to conclusions. I suspect there is not much of a surprise that the largest group babies come up in the countries that can least afford them.
- A celebrity I shall not name since I have no permission and only a rumor to go on apparently looked at this and decided that the poorest, largely sub-Saharan African, not only had the most babies but when they become more prosperous did not lower their fertility as fast as the middling group did. I can accept that. Then he decided that it was because they were not as bright as the rest of us. That was mistake number one.
Forgive me for digressing. My grandfather, according to family lore, made the highest grade average of anybody who had gradated from his college; the record stood until he was eclipsed by both his sons. This grandfather, the kindest man I ever knew, was chatting once with a hired man, who used the word, “Boliform.” When asked what it meant, the hired man said it was African for elephant, he being of African extraction. Well the story went to one of my brothers, who graduated in English from Harvard, and thence to me. Being of low suspicious mind compared with these other men, I cudgeled my brains for years. After all, there is not just one African language; they are countless. Then I got it. A bolus is a mouthful of food after it has been chewed and before it has been swallowed. Just as cruciform means shaped like a cross, boliform means a shapeless mass – not so bad a description of an elephant. Instead of explaining the hired man concocted the story to be polite.
I could give examples of times when I was blessed with the same good manners, but since these are uncontrolled observations they prove nothing. But it would take a mountain of evidence to persuade me that Blacks are not very intelligent.
Alas the celebrity compounded his error by flapping his yap. To say his reputation suffered would be an understatement. Had he manifested a bit of African courtesy he’d have kept his job and been more highly thought of to this day.
- But the fact remains that the poorest have the most babies, and the temptation is real to think that the people in richer are being more responsible. Don’t buy into that. We know already that kinship issues alone determine fertility. Actually folic acid does, too, be we shall not be getting to that for a long time. For now, let’s look more closely at the numbers we have seen.
- If you follow the least developed curve down until it overlaps the middle, then follow the middle down to overlap with the most developed, the composite curve looks like this:
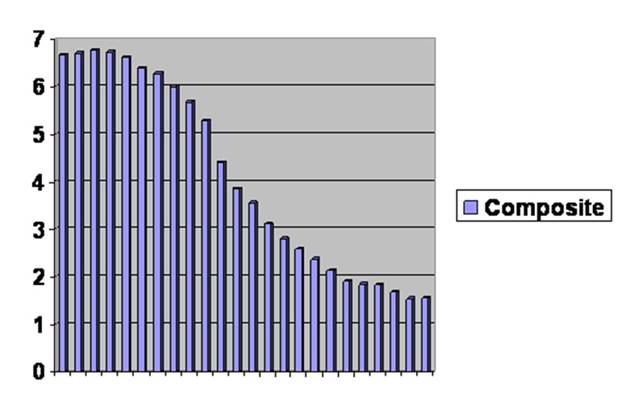
It’s all the same curve. You can’t even tell where the edits are.
Don’t let anybody tell you there is a serious difference between groups of people. So far as fertility goes, we are all riding down the same slope, just separated in time.
Don’t buy into the notion that the rich world has stabilized. We have been below replacement for 30 years. Since there is no evidence I know of that the rich world has begun marrying cousins, the low fertility must persist. It may go to zero, but with current mating strategy it cannot go back up.
Cut to the chase and go to nobabies.net, the summaries, papers and source code if you have the fortitude.
Most Dreaded Terror 7 first flies

It is the 2nd of February 20, 2018, but don’t worry about the date. The quarry here is our ancient enemy; it has been doing us dirt for longer than we have been human. The mechanism may take a few generations, but it can drive the birth rate right down to zero and keep it there.
- An immediate challenge is whether this can be proven experimentally. The paper by Sibly I mentioned earlier showed that the mechanism, and he explicitly stated that there had to be a mechanism, is seen in mammals, birds, fish and insects. Of these, insects are so far down the food chain so-to-speak that just about nobody cares much about how you abuse them. I hasten to say that I never planned to and never did deliberately abuse my insects. How they felt about it all they never said.
- The most popular insect for laboratory studies is of course the fruit fly, Drosophila melanogaster. They can be purchased cheaply; I got mine from North Carolina Biological Supply. My initial plan was to cross together flies that had been unrelated for a long time. The pleasant technologist I spoke with assured me that all the lines they kept had been there longer than the three years she had worked there. I bought sixteen lines of flies, one wild type and fifteen more each with a specific mutation, so the lines were unrelated for many generations. Standard fruit fly husbandry dictates you start a new line with four males and four females so each time I crossed them I would take four males from one line and four virgin females from another. Calling the lines “a” through “p,” I crossed a with b to bet ab, b with c to get bc and so forth until I crossed p with a to get pa. Then I crossed ab with cd, bc with de and so forth, so every generation I kept 16 lines going. Eventually I had lines abcdefghijklmnop, bcdefghijklmnopa and so on for 16 lines, each descended from each of the original 16.
It wasn’t so straightforward. Lines would die out, particularly after the first few generations, and my technique was not perfect. Sometimes a male would find its way into a vial of virgin females. I would have to go back and get vials that had gone according to plan.
My four generations never gave me complete infertility. I do not know what would have happened had I been technically able to carry it all out for five or six generations.
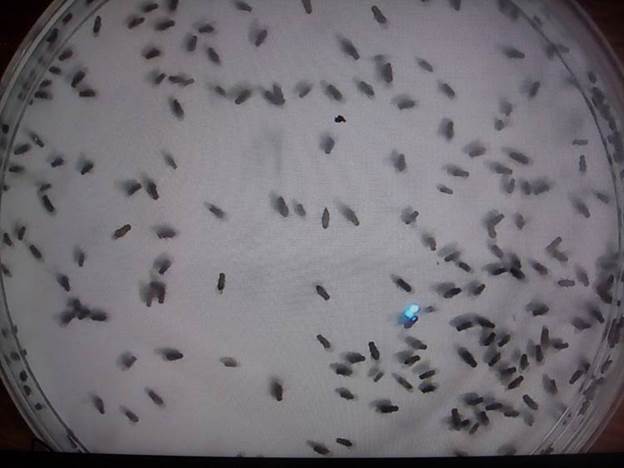
- So I released the flies in a large cage:

You thought you were cramped for lab space. Here is an inside view:
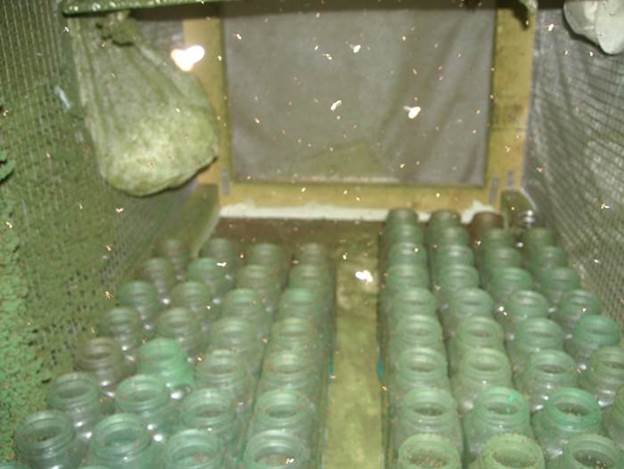
Each day I would add four new bottles and remove the four oldest, which had been in there for 28 days. I made daily counts at two measured windows and summed them at two-week intervals. The result was this:
-
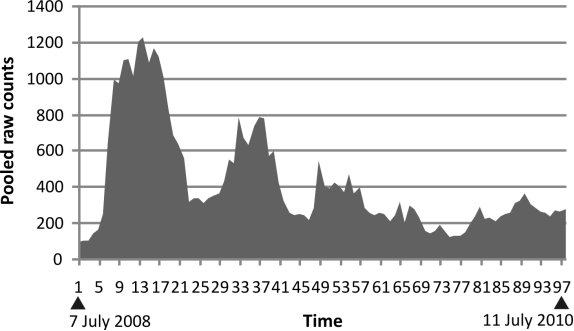
It is noisy, but you can see damped oscillation. You may also notice that each cycle shows a rapid rise and slow fall. I wish I could claim I had been clever enough to predict that would happen from the Sibly curve. The speed with which changes occur indicate that this is an epigenetic process, not genetic.
- So we can draw some conclusions:
- Yes kinship governs fertility in fruit flies.
- The mechanism gives the same result as seen in the Sibly paper.
- Despite my dastardly designs, the flies never died out. It seems clear that the fertility of laboratory bred fruit flies is quite robust.
- We have an experimental model with which to pursue an understanding of the mechanism.
- The mechanism appears to be epigenetic, involving the control of genes, not their DNA sequence.
Most Dreaded Terror 8 first model
Dore “Raven”
https://hyperallergic.com/102457/rediscovering-the-dark-splendor-of-gustave-dore-with-edgar-allan-poe/ downloaded Feb 18, 2018
It is the 8th of March 2018.
- Some days you have to learn a new word. The three most important kinds of things in society are relationships, tools and words. I kind of like the old ones and understand if you don’t want to learn one, but grit your teeth. The word is “zygote” and we’ll be using in in two forms. It means “yoke” as in a yoke of oxen. But in histology (no you don’t need to learn that one) the word means a cell that has been formed by a sperm entering an egg (ovum):
 SPERM + OVUM ZYGOTE
- When we speak of the mechanism of infertility, the first logical step is to distinguish “pre-zygotic infertility” from “post-zygotic infertility.” Thus there are two forms of the word zygote we must know. Pre-zygotic is what happens before the zygote forms and post-zygotic happens afterwards. Since there is clearly a mechanism, as Sibly pointed out, for relative infertility brought on by lack of closer kinship, is it pre-zygotic, post-zygotic or both?
- The Icelandic data we looked at earlier showed lower kinship reduced the number of children and the number of grandchildren; to a first approximation, this suggest both pre-zygotic and post-zygotic mechanisms in action.
-
I had written a computer program in C++ language. The program modeled only a post-zygotic mechanism using an epigenetic process. Eager to spread what I knew I had copies made on CDs. I was not so eager but what I had the executable code locked on the CD. I sent the master off to a place in Israel, the only service that offered to make protected discs of anything but music. I got a prompt message saying that some of the things in included were in folders, and the disc could not be properly secured unless everything was out in the open. If I had been paranoid before, that receded. There could be no explanation but the were copying everything they were “protecting.” No problem. If they wanted to try to steal it, the source code was copyrighted. And any attention was welcome.
I still have a couple hundred copies. If you want one, I’ll send it to you for a souvenir. Your current operating system may not work on it, and your security system may judge it dangerous. With an old computer and no security, you might be able to make it work, but since it has been out of my hands I can’t swear there is no virus … although I have never had evidence for one. If the discs prove so popular that the time and cost are significant, I may start asking you send a prepaid envelope.
But you don’t need it. Go to nobabies.net and look at the source code. If you think it’s safe, compile it and you’re off and away. The posted version includes a pre-zygotic model. Don’t turn that on, and you’ll have essentially the post-zygotic version.
- So I tweaked the parameters (if you take interest you may do a lot of that). Until I got this:
Does it look like damped oscillation to you? Rapid rise and slow fall of fertility? It does to me. It seems beyond doubt that we are hot on the spoor of the mechanism.
- We see evidence for a post-zygotic mechanism but in the lab we don’t see a pre-zygotic process. If there is one, it can only have limited power. When the Spanish learned that Cortez had murdered Montezuma, they were shocked. Giving the treasures of Mexico and the land back to the rightful owners was out of the question, but they Spanish court brought Montezuma’s children to Spain and made them part of the royal line. The continue to this day. Earlier contact between those who left Africa and went north and those who went east must have been quite limited. How long had Spaniards and Mexicans been separated? A thousand generations or so? It seems clear that, post-zygotic fertility in both parents permitting, pre-zygotic infertility cannot be absolute.
- We have seen damped oscillation in the lab and in the computer model, next we shall look at some animals in the wild.
Most Dreaded Terror 9 voles
(Sorry. word won't pass the picture to Dreamweaver, but you can look at it on YouTube )
https://www.google.com/search?hl=en&tbm=isch&source=hp&biw=1144&bih=550&ei=Cto2WqffDKHZjwTHhJC4Ag&q=golden+eagle&oq=golden+ea&gs_l=img.1.0.0l10.3546.7387.0.12686.9.7.0.2.2.0.113.701.4j3.7.0....0...1ac.1.64.img..0.9.701....0.yLmWTHVr1LA#imgrc=FydfOeIiBZmupM: downloaded 12/17/17 and some help from Photoshop
It is the 9 of March 2018.
Voles are simply adorable:
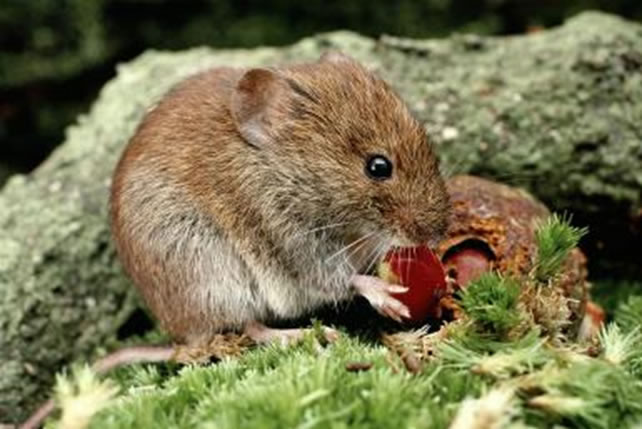
https://www.google.com/search?hl=en&tbm=isch&source=hp&biw=1202&bih=650&ei=BomUWvK6D6aatgX9oZiYAQ&q=voles+images&oq=voles&gs_l=img.1.2.35i39k1j0l4j0i10k1j0l4.8710.12445.0.16492.8.8.0.0.0.0.137.390.4j1.5.0....0...1ac.1.64.img..3.5.389.0...0.rLdn_BKFQWs#imgrc=4v_JRw3TFBAzeM: downloaded February 26, 2018
Don’t let the title mislead you. I am not saying that we should lie awake at night trembling at the thought of what voles might do to us. Save that for the mechanism we pursue here; if you have followed the videos this far, you know enough to be worried.
Besides, I don’t want to slander the cute little voles … or anybody else for that matter. But look at this:
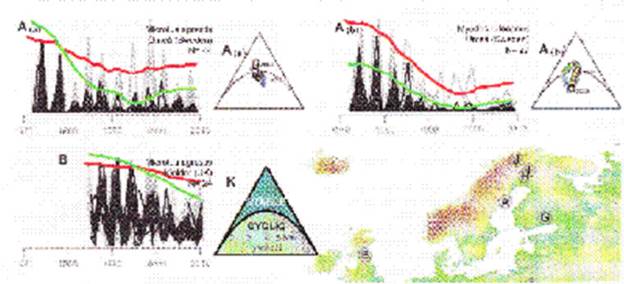
-
Counts on the vertical axis, time on the horizontal.
T. Cornulier et al. Europe-wide dampening of population cycles in keystone herbivores. Science 340, 63-66 (2013).
In a number of places in Europe they have stations where they regularly count voles. I can understand that it’s more fun to count voles than to count animals that are more dangerous or less cute. While they have counted over the years the populations have gone up and down. No problem there. But they were meticulous enough to sum up their data and astute enough to notice a recurring pattern. The pattern was something they called damped oscillation.
- Again and again they would see a population rise and fall in a cyclical pattern with each peak being somewhat lower than the one before. I only copied three sequences, but they published more. Since we have seen a pattern of damped oscillation in a captive population in the lab and in a computer simulation attempting to model an epigenetic (concerned with the control of genes rather than with the DNA sequence of genes) mechanism that links fertility with kinship through a post-zygotic process, I think a reasonable person would react, “Ah, yes. It had to happen somewhere. This is what we should have expected.”
- One point to notice is that in the lab and on the computer the peaks exhibit a rapid rise and slower fall of fertility. I do not see that pattern in these wild European voles. I suspect that the pattern has been obscured by statistical noise. We are still on the trail of our quarry.
- In all my travels I have never seen this pattern in humans. If I had to wave my hands I’d say that human populations small enough to exhibit the same pattern simply are not conspicuous enough to turn up in the historical record.
- As for what does turn up, we shall begin next time to follow the same sorts of counts … or at least a proxy for the same counts … among humans for just about all of history.
Most Dreaded Terror 10 Mesopotamia
Dore “Raven”
https://hyperallergic.com/102457/rediscovering-the-dark-splendor-of-gustave-dore-with-edgar-allan-poe/ downloaded Feb 18, 2018
It is the 13 of March, 2018. In the last talk I was giving data on voles, how vole populations in Europe often follow a stereotyped pattern of damped oscillation over time. This pattern has been seen in the lab with fruit flies, in a computer simulation and now in the wild. However, in all my wanders I have never seen it reported in humans. I imagine it happens but has never been noticed.
One things humans do notice is when an empire falls. A civilization reaches a certain degree of development, and then barbarians sweep in killing, looting and burning so that the language and culture are extinguished or else another civilization comes in and does the same thing.
But think about that for a moment. The original civilization has food, transportation and a standing army. It is said that in a battle the attacking force needs a ten to one advantage. But for an invasion at a distance things are even worse. Food, weapons and discipline must be maintained and brought along in an orderly way. Defections must be minimal. Sanitation and health are important, likely more important than victory in the field. All this should not succeed often, yet it does with regularity. How is that possible?
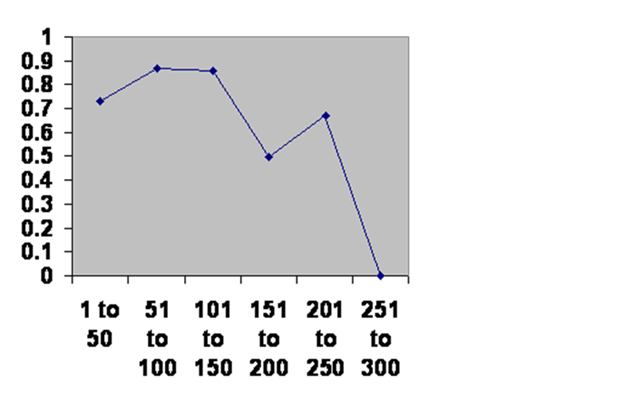
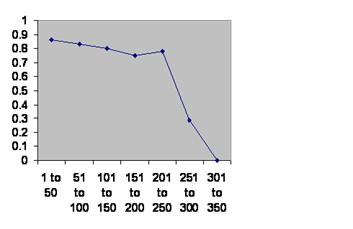
One kind of data that can be amassed with reasonable confidence turns out to be the dates of the collapses; a lot of things change: the language, the religion, the government and so forth. What I have done was to look at the dates in lower Mesopotamia, Iraq. (My knowledge of Syria in upper Mesopotamia is not adequate.) I got together how many years (broken into 50 year intervals) each civilization survived. Then I calculated how many survived fifty years, how many survived from between 50 and 100 years and so forth. Then I calculated the chance of making it 50 years, the chance the survivors had of making it to 100 years, now their chance of lasting to 150 years and so forth. I present it as a graph. If you have tears, prepare to shed them. I did make one tweak. The Ottoman Empire was ruled by an autocrat. But it was a lot of work, so he appointed a vizier to do the usual business. Beneath him, in early years, were a group of slaves, the Janissaries, recruited from the Balkans. The were the elite soldiers, the administrators and generally made things work. But the supply of them ran out after many years and from then on they became a hereditary class. I count that as being two empires, although nominally they were the same empire.
Chance of surviving the next 50 years is on vertical axis
-
Age of the empires in years is on horizontal axis.
Information taken from R. H. Carling THE WORLD HISTORY CHART International Timeline. In about 1574-1596, the Ottoman Empire changed the way they recruited the Sultan’s personal guard, the janissaries. We count them as two empires changing then.
You can look at that graph a long time. It covers all of recorded history into the 20th century, so the numbers aren’t going away.
First notice that the line is very clean. If there were a number of reasons a civilization might fall, all unrelated to each other, the line would be noisy. If there were hundreds or thousands of data points, that might smooth the line out. But since the graph covers 6,000 years the number of regimes is in the dozens. If the line is this smooth there can only be one or two reasons the civilizations fall, presumably related reasons.
On class of things that might bring down a civilization would be disasters coming from outside: overwhelming invasion, depopulating plagues, climate change. In that case, the outside threats would have nothing to do with the ages of the civilizations and the line would be level. It is not level.
Another kind of threat would be problems within the population itself such as the wrong technology, the wrong kind of government, the wrong religion, the wrong genes. In that case there would be a kind of selection in which the less favored civilizations would collapse first and what was left would be more durable. In that case the line would rise. It does not rise.
Therefore civilizations are doomed because of something that is neither inside of the population nor outside. Consider: the most expensive thing I own is not in my house, nor is it outside my house. Obviously it is my house itself.
I say doomed. As any civilization ages, it gets more and more likely to fall. As it approaches 300 years, its chance of survival drops to zero. At least that is true in this place over this enormous span of time.
The only thing that can be at work is that, given a population big enough to maintain a civilization – or to administer it – fertility will eventually collapse. There is just no other possibility without invoking forces outside nature, and it is forces within nature that we must concern ourselves with. Nothing else permits prudent choices.
Look long and hard at this graph. In order to escape this doom we must understand it. That means we must know the mechanism. That is where we are going.
In the next talk I shall show that this effect is not limited to lower Mesopotamia.
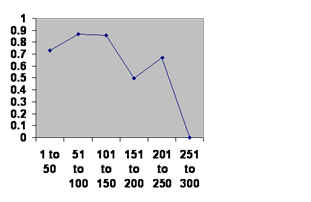
- Most Dreaded Terror 11 farther West

-
- It is the (roughly) the end of winter, 2018
In the last talk I was showing you the time course of collapse of civilizations (regimes, empires, what have you) in lower Mesopotamia. I also pooled the experience of Rome, the classical Mayans and the Anasazi. Rome was a bit tricky, since it survived for a long time in name while the ruling powers changed from time to time. For instance, the first rise of the emperors I considered a change. I drew the information from the BBC. I don’t have my source for the classical Mayans, but it appears that they went through about three clear cut changes. The Anasazi are now called the “ancestral Pueblos,” but I am a bit uneasy about that term. I certainly accept that they were related to modern Pueblos, but whether the ancients that are studied actually have modern descendants is problematic. If my records serve I drew from The Collapse of Complex Societies. Joseph A. Tainter. Cambridge University Press. Cambridge. Eighteenth printing, 2009.
As before the age of each regime when it fell is on the horizontal axis in 50 year increments. The vertical axis is its chance of surviving that half century after it has entered that half century. If death came from outside, the viability of a regime would have nothing to do with how long it was since it was founded, the line would be horizontal. If regimes differed significantly between populations, there would be selection and regimes that had lasted longer would continue to last longer; the line would rise. But the line again falls:
Chew on it. The line is clean as can be, so only one process must be a work knocking down these regimes. There is the same 300-year brick wall, so it must be the same mechanism. And the line goes down proving that the effective mechanism is neither within the population nor outside the population so it has to be the very fact of a population that is big enough, or an administrative class that is big enough, to serve the needs of a civilization.
I concede that there is a bit of overlap. The Romans did indeed once rule Mesopotamia, so they potentially figure in both graphs; knowing whether that is true would require more historical savvy than I have. A professional historian ought to be able to tell, but I have been unsuccessful in getting any expert to take an interest.
That simply overwhelms me. How any expert could look at this unmoved is baffling. It’s as if you were to spend your life looking at the mouth of a cave and watching what came and went. If a sheep goes in, a lot of roaring comes out but no sheep. Bats come and go. Bears come and go with the seasons. And then somebody tells you how to enter the cave safely and look around. It ought to be irresistible.
In fact, I don’t know how anybody could fail to be captivated. If I might digress with a little personal history: I have always dreamed copiously. When I was young my dreams were sweeter than they are now. I won’t complain; the frustrations in the dream are not so intense as the frustration of doing what I am now doing in vain. But the sweet dreams of youth do not return.
A down side of such dreaming was that I would awaken and yearn to return to the dream. Well and good; I’m sure such things are not rare. But sometimes the same wistful yearning would strike me when I was wide awake with no dream being remembered. I asked my parents what it was. I don’t think they understood any better than I do now. I assumed it was a fancy of youth and I would outgrow it, but middle age arrived and I still occasionally would feel it, sometimes when I was quite preoccupied with things of immediate importance.
I suspect poets have described it, Victorians mostly, including Edgar Allan Poe. But I have never known a word for the feeling. It was like I was homesick for something that had never happened. It was not unpleasant and was easily shrugged off, but it was an enduring feature of my inner landscape.
I happened to become involved in the issue of the health of US veterans. That deserves a talk all on its own except that it is not obviously related to the issue of the mechanism of inbreeding and outbreeding depression … well maybe don’t you know? … I mean if nature expects us to live in communities of a certain size and make-up … and if we don’t … sorry I can’t lead you to it with iron clad logic nor articles in prestige science journals … but maybe.
But moving back toward topic, putting somebody into combat is a horrible thing to do to them. So they day came when we went to war in Iraq.
Saddam Hussein had asked the US ambassador whether it would be all right to take the Kuwait oil fields. The US had been trying to get permission to put up a military base in Kuwait, but had been rebuffed, so instead of saying, “Try it and we’ll blow you to smithereens,” the American official said, “Arab borders are Arab business.”
Kuwait was overrun. The US moved troops into Saudi Arabia and then on a day invaded Kuwait to drive Iraq out. At least that’s how I remember it, which is my point. The truth of matters I am happy to leave to others.
So I literally was lying on my couch thinking, “This is an unnecessary war, and they know perfectly well how terrible war is for all concerned. WHY?
“Why do people choose leaders who act upon the hatred of outsiders that normal people only mutter about? What such hatred in the first place? There must be a selective advantage to it. It has to be biological.
“Maybe societies, biggish ones, get unstable simply because of their big and diverse mating pool. How long does a society last anyway? Is there a clue in that?”
So I put together the numbers I showed you for lower Mesopotamia. The graph you have seen became to whole focus of my life.
Emotionally I have never recovered. Those sweet wistful dreaming moments vanished altogether. Nothing was left but the burning need to warn the world.
So how anybody can look at either of these graphs and then forget about them escapes me.
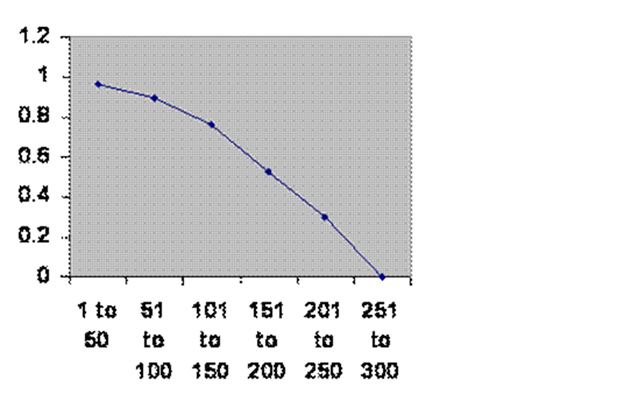
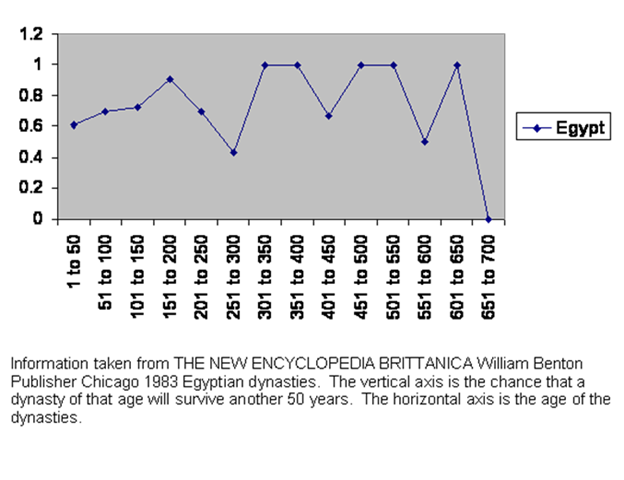
Most Dreaded Terror 12 Egypt
It is the 17 of March, 2018. Here is the survival experience of Egypt.
You recognize the coordinates (survival as a surrogate for young people against time) of the Mesopotamian graph quite different from the coordinates (fertility against kinship) of the Sibly graph.
An innocent observer might well look at the line, say it’s zig zag and conclude it means nothing. But if you have followed these talks you are not innocent. You know the truth. I’d not have done it for the world seeing what the knowledge has done to me, but this is an emergency and survival depends on having a lot of capable people working on this. As for me, there is no choice; the incubus is upon me.
Looking at it with your trained eye, you will at once break it down into three time periods. Over the first two hundred years the chance of survival rises steadily, as would be expected if there is selection.
Egypt lies along the Nile and setting up an administration is difficult. If you have a problem 20 miles upstream you don’t know what is happening on the other side of the rebellion. It takes a couple of centuries of shakedown to reach a good chance of survival.
Here is a map of Egypt; you can see the problem. The Nile valley is that wiggly green bit. And of course there is the delta in the north, where the green is a lot wider.
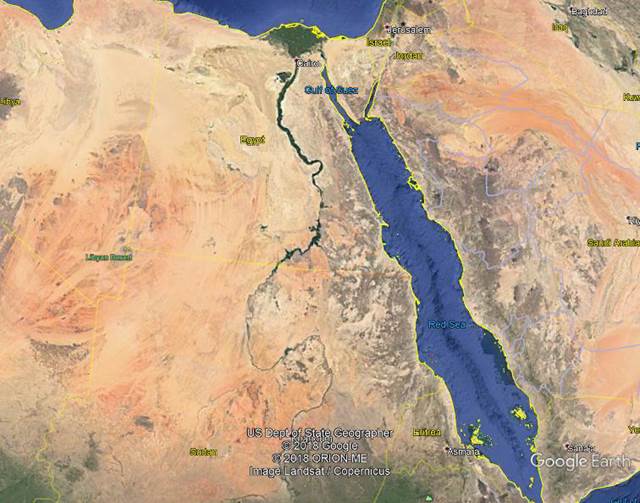
- The valley varies in width, sometimes something like 10 miles across.

At the edges, the land rises abruptly to the desert:

- The river tends to be narrow and to run at the edge of the valley. None the less, you aren’t going to find marriage prospects out there in the desert any more than you’re going to find the king’s couriers. Your range of choices of mate is less along the river than in the delta, where on average you are a long way from desert.
So for two hundred years we have selection and survival rises because some groups may really be better at setting up an administrative structure and quelling descent than others are.
Over the next hundred years, there is the expected decline in survival that we found elsewhere.
And then something rather remarkable happens. Survival goes through the roof. Throughout all of history in this area just three regimes broke through the three-hundred-year brick wall. No doubt they had some help from geography. For one thing, the rebels, too, would have had difficulty getting organized. But for another thing the restricted social choice caused by the geography looks like it meant that, in upper Egypt anyway, people tended to marry kin sufficiently often to produce an excess population, which could move downstream and repopulate the delta, which one would expect to suffer from infertility.
Most Dreaded Terror 13 China
I
It is the 19th of March, 2018. Here is the survival experience of Chinese dynasties.

Information taken from John B. Teeple TIMELINES OF WORD HISTORY, DK Publishing, New York, NY, 2006, page 554, 555
Yes these are dynasties, not civilizations. The first Chinese emperor was in about 200 BC. The line of emperors continued into the 20th century – always the same civilization. It makes the West look pathetic in comparison: three hundred year brick wall, indeed. Even the dynasties make Western civilizations look sick. For the first 200 years every dynasty looks almost – but not quite – invincible.
This long period of great stability depended on a remarkable strategy. (I am no expert on history, so I can only give you what I have heard.) Each year boys of a certain age were given a test on the sayings of Confucius. The bulk who did not excel could look forward to a life of very hard work, poverty and very little freedom. The ones who did best got a choice: stay poor or get castrated, in which case the qualified for work in the administration of the government. It would be as if we decided here to castrate all the doctors, lawyers, politicians, millionaires, university professors and scientists. I daresay that there are those who might favor such a plan, but don’t expect our overlords to start pushing it.
The upshot was that there were no powerful families. There was no concentration of power that might threaten the imperial house. Then over a hundred years they all collapsed. Just one appears to have gone on to 350 years. What’s going on? The imperial household presumably was exclusive but large. They married cousins all right, but that range of choice soon exceeded the critical number that can be survived. At the end they all ran out of children – or ran out of a sufficient number of capable children – and the dynasty fell.
Notice the notch slightly before the end. For about fifty years the dynasty is somewhat more vulnerable, but it then recovers. Implicitly there was a fertility crisis that then passed. I think a reasonable person might well shout, “Noise.” It could just be a statistical fluke.
If this were the only data, I would totally agree. But as the data sets pile on, that explanation will become untenable.
What I don’t know is whether this notch is caused by the same thing as the notch in the Denmark data. You remember that, of course. Just where the degree of kinship should be producing the greatest fertility, there is a little decline:
Comment on “An Association between Kinship and Fertility of Human Couples,” Rodrigo Labouriau and António Amorim, SCIENCE vol. 322 no. 5908 December 12, 2008 page 1634. For the whole story also see Human Fertility Increases with marital radius. Rodrigo Labouriau and António Amorim. GENETICS volume 178 January 2008 page 603.
This used to annoy me considerably, since it seemed to mar the beauty of the Sibly curve. But I don’t know. That curve is fertility against kinship, the present curve is survival (as a surrogate for fertility) against time. If there is a causal connection, I should dearly love to have it explained. Instead we shall go on to Japanese dynasties.
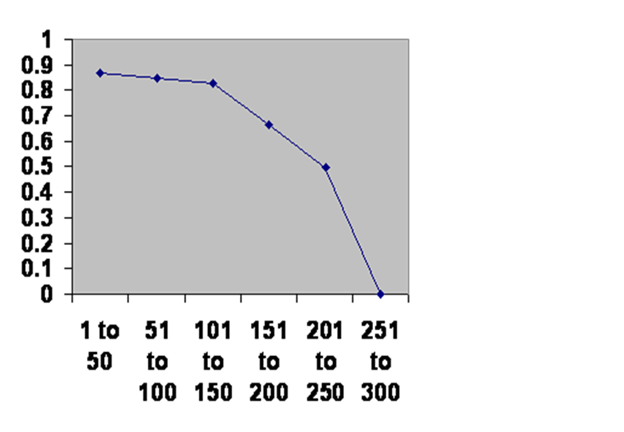
Most Dreaded Terror 14 Japan
Dore “Raven”
https://hyperallergic.com/102457/rediscovering-the-dark-splendor-of-gustave-dore-with-edgar-allan-poe/ downloaded Feb 18, 2018
It is the 22 of March, 2018. Here is the survival experience of Japanese dynasties.
Information taken from John B. Teeple TIMELINES OF WORD HISTORY, DK Publishing, New York, NY, 2006, page 554, 555 Japanese dynasties. The vertical axis is the chance that a dynasty of that age will survive another 50 years. The horizontal axis is the age of the dynasties.
By now you are thoroughly familiar with the axes. The probability that a dynasty (yes, we are talking dynasties now, not civilizations as in other parts of the world) will survive another fifty years is on the vertical axis graphed against age on the horizontal. The result is most impressive, although no match for China in stability.
For one thing, notice that over the first fifty years the chance of survival rises. Remember there was a lot of that in Egypt. Japan is an archipelago. Although it is long and thin (and looks sort of like a dragon if you turn the map south side up) there is not the isolation of the desert. A kind Swedish woman once remarked to me, “In the old days water did not separate people; it brought people together.” If anything, it would be the precipitous mountains of the interior that would limit travel. Instead (drawing on my almost total lack of knowledge of history) I suspect it was the noble families, the bureaucrats and court officials. Potentially they had the clout to challenge a new dynasty.
Now notice the notch. It occurs at the same time as the notch occurs in China.
China:
Japan:
I’ll not say “exactly” the same time, since we have lumped things into 50 year increments. But it as close as we can tell. And the notch is deeper than it was in China. I suspect that when lowered fertility leaves the imperial dynasty vulnerable the same powerful families still kettle like so many waiting hawks and vultures, looking for a time to stoop.
In such an environment it is not surprising that no Japanese dynasty makes it past the 300 year brick wall.
It is the 24 of March, 2018. Here is the survival experience of a community of native American farmers in the American Southwest in a place called Long House Valley.
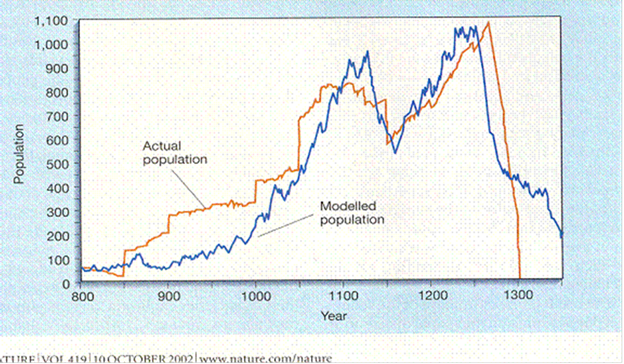
Jared M. Diamond, “Life with the Artificial Anasazi,” NATURE, vol. 419 no 6907, October 10, 2002 p 567
- Diamond’s excellent work here deserves close study. Of course, you see the notch, which we have seen in humans two or three times already. The red line, “actual population,” is an estimate of the population reached by doing carbon 14 dating on every bit of charcoal they could find in the valley. That gave them a number of houses that were occupied in any one year. From that they calculated a population. Obviously this is a more direct measure that simply looking at how likely a dynasty is to fail and inferring a lack of capable people. So we are not surprised to see that the notch in the population curve is a good deal deeper than the notches in the dynasty curves.
- The blue line, “modelled population,” is a measure of the climate estimated from tree ring widths during the years in question. A computer matched the curves to give a closest fit. The match is so good that it seems inescapable that there is a causal connection. Either the tree rings are causing the population to change, the population is causing changes in the tree rings or they are both the result of some other factor.
- Diamond went for number three: the tree rings reflect rainfall, and rainfall limits the number of people the valley can sustain. Since number one is not viable, number three seems reasonable, but it is not perfect.
- Starting in the year 800, some people move in; their numbers decline. If the people came from a traditional community, that community was probably in good balance, the size being about right for zero growth as predicted by the Sibly curve. Since only about 50 people seem to have come, that would be a very few families, and they are dealing with inbreeding depression.
- In 850, more people move in, and the population begins to grow. That on the face of it is a puzzle. Rainfall as inferred from tree rings should not be able sustain them, much less permit population growth.
- The years 1000 and 1050 show the same thing: immigration into the valley and growth that should not be sustainable. All the while the tree rings indicate more and more growth. By 1100 the trees are suggesting that the valley can sustain 16 times as many as it could 300 years before.
- I do not in any way mean to cast a shadow and this fine study. Diamond has asked the right question and put together a large amount of relevant data. What happens to a population if you just cut it loose and let it run. Diamond suggests that population declines are due to people moving away when they cannot support themselves in the valley. But the evidence suggests that these people move in groups, and after the 1050 migration there is no unequivocal instance of any migration. War, famine and plague should show a stepwise decrease indistinguishable from an exodus is numbers were significantly affected.
- And from the migration of the year 1000 to the end when the valley fell empty would be 300 years. Thus it appears that these subsistence farmers had the same population time course and the same profile – notch and all – as the course and profile of dynasties that ruled all of Asia. It’s all mating pool size and kinship. Accident of status means nothing. Actually there is the question of folic acid we have yet to describe, and of course cheap cloning of humans might potentially change much in the future. But our evidence comes from the past.
- Notice in closing that of the two population peaks, the second is higher than the first. We shall see that again in another context.
Most Dreaded Terror 16 Mouse Plagues
Dore “Raven”
https://hyperallergic.com/102457/rediscovering-the-dark-splendor-of-gustave-dore-with-edgar-allan-poe/ downloaded Feb 18, 2018
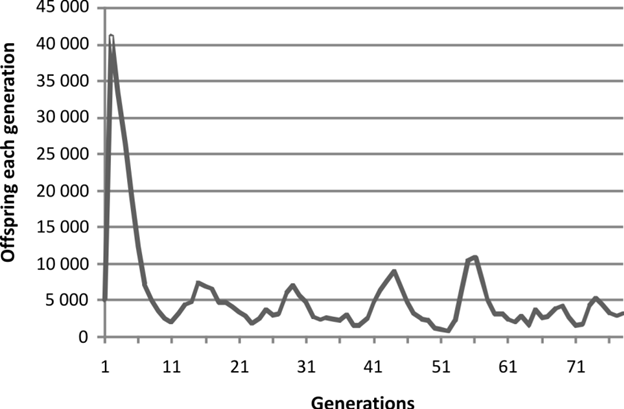
It is the 27th of March, 2018. I have written and tested a computer program in C++ language; it took years. I am not good at that kind of work, but it seemed so important that I had to learn the programming language. The capabilities of that language are far more extensive than what I can understand. I think you could write out what I know on a three by five card. Fortunately it proved adequate to the needs of the day.
I’ll go into the program so day in the future, but just to get you acquainted, here is the result of a run in which I simulated both a pre-zygotic process and a post-zygotic process influencing the reproductive rate of a virtual population. It is customary in a movie to assure the audience that no animals were harmed making the movie. I cannot make that claim for computer chips in developing the program. I sit here surrounded by old computers I have burnt out by pushing them beyond their actual (as distinct from advertised) capability.
Here is the run. Each vertical line is a simulated generation with a height which is proportional to the number of offspring in that generation. Each generation offspring were removed at random down to the maximum to which the population was limited. If the number of offspring was less than that limit, none were removed:
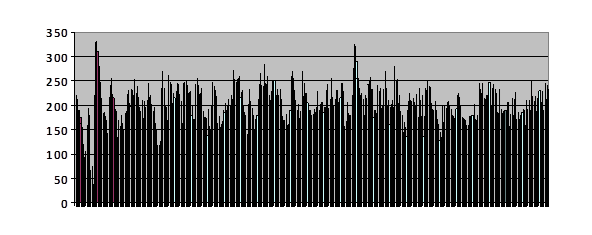
The limit was, I think I remember, 100.
I had done a run in which the population was limited to 200, and saved them. Then I pulled 100 out of the recorded virtual individuals and let it run. There was a brief hiccup during which the number fell below 100 followed by a corresponding peak. After that the number varies a great deal – looks very noisy – but I recognize no overall pattern.
Now, quite fortunately, I can offer you some real world data.
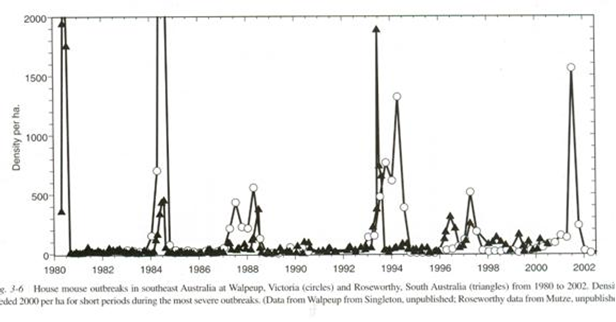
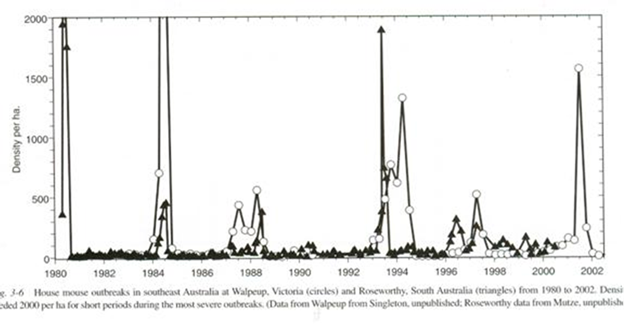
G. R. Singleton, C. J. Krebs, “The secret world of wild mice” in The Mouse in Biomedical Research, J. G. Fox, M. T. Davisson, F. W. Quimby, S. W. Barhold, C. E. Newcomer, A. L. Smith, Eds. (Elsever, Burlington, ed. 2, 2007), vol. 1, chap. 3, p. 39.
The book is several volumes long and expensive. Much of it is beyond me, but the chapter by Fox et al. is charming and most helpful. In Australia and New Zealand there are periodically plagues of mice when their numbers increase greatly. They have counting stations where they record mouse numbers. The graph shows counts from a few such stations. Plagues will frequently follow a drought. Numbers rise very high and very fast. At other times the numbers are low and rather stable.
I am not entirely happy with my computer run in a couples of regards. In the simulation, numbers are rather stable but this is because a hard ceiling is in place – a limit to population size. So that proves nothing. The fact that plagues follow droughts suggests that numbers are reduced by a drought leading to the same rebound the computer run shows. But when I look at the mouse data I do not see such a reduction in numbers. Perhaps more frequent counts would have shown it, but I cannot claim evidence here either.
The thing I find exciting is that on two occasions we see a double peak for all the world like the population peaks in the Long House Valley experience. At first glance it may look like there are three such double peaks, but in fact that is the fortuitous juxtaposition of spikes at two different counting stations.
What I cannot explain is why the European voles show the same conspicuous damped oscillation as the laboratory raised fruit flies, the mice here never seem to show such a damped oscillation.
I hope to return to this point and make a suggestion after we have looked at Japanese quail in a future talk.
I shall also return to this graph when we discuss laboratory bred mice.
Perhaps somebody more deft than I can use my source code, available on nobabies.net now and to be discussed also in the future, and give a more plausible demonstration of a stable baseline. But even so, this is a most valuable data set from which I expect to show more about the mechanism of the link between kinship and fertility.
Most Dreaded Terror 17 Deer mouse
It is the 29 of March, 2018 We are slowly closing in on the mechanism that links kinship with fertility. My own data suggest that at least one mechanism must be post-zygotic in nature since my fruit flies followed a population time course that could be generated by a computer program that was purely post-zygotic.
Now I shall offer a piece of evidence suggesting a pre-zygotic component.
Widespread in North America is a rodent called the deer mouse. Now males compete. Professor Don Fawcett showed us, when I was at Harvard Medical school, some pictures of different kinds of sperm. Most of us think of sperm as all looking about alike and rather simple, which is true enough of human sperm. But that day the good professor showed us the sperm of a Lydian jird. The head of this gamete was extremely complex. I suspect now that this was because these sperm compete with each other.
A jird, think gerbil, is a gentle creature; they make good pets, and I should not be surprised to learn that they don’t fight much in the wild. But the sperm compete with each other I presume.
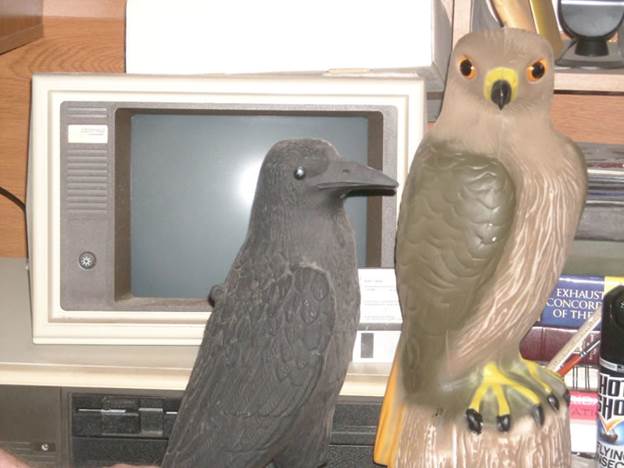
That happens in other animals, but it is not the invariable rule.

https://www.google.com/search?hl=en&tbm=isch&source=hp&biw=1072&bih=657&ei=SfimWrbtJ4jysAXsg4HYDA&q=deer+mouse&oq=deer+mouse&gs_l=img.1.0.0l10.3936.8550.0.12618.11.10.0.1.1.0.80.604.9.9.0....0...1ac.1.64.img..1.10.601.0..35i39k1.0.fEKNiQ7cN44#imgrc=sm3aC84UdK3T3M: downloaded March 12, 2018
Sperm also cooperate. In the deer mouse that can stick to each other and form a sort of flying wedge.
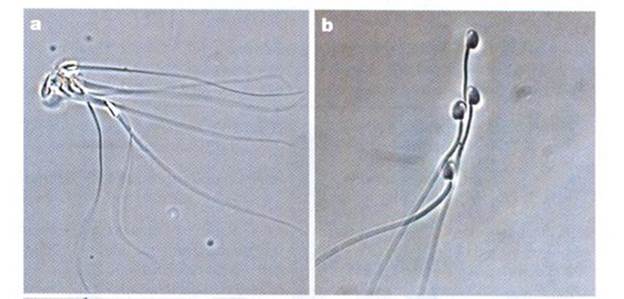
Pictures from Competition Drives Cooperation Among Closely Related Sperm of Deer Mice, Heidi S. Fisher and Hopi E. Hoekstra, NATURE vol. 463. no. 7282 February 11, 2010 page 801.
Evidently the formation swims faster.
Sometimes they overdo it. Here are some sperm that have been stained for tubulin:
(I’m sorry I cannot lay hand on a reference) I fail to sense a competitive advantage this formation confers.
But here is the zinger. The males of closely related sperm are much more likely to form up than of “unrelated” – very distantly related – males. So sperm, at least in this species, recognize kinship.
If they match, they get together. All that is needed, then, is that the egg does the same thing and the mechanism exists for pre-zygotic infertility for gametes not sufficiently related.
Most Dreaded Terror 18 Calhoun
Dore “Raven”
https://hyperallergic.com/102457/rediscovering-the-dark-splendor-of-gustave-dore-with-edgar-allan-poe/ downloaded Feb 18, 2018
It is the 5th of April, 2018 We are still closing in on the mechanism that links kinship and fertility.
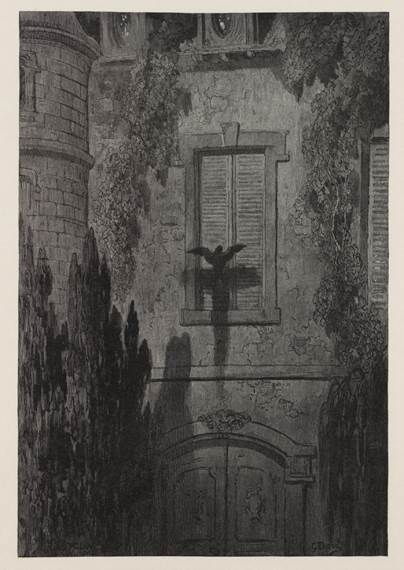
Back in 1973 a man named J. Calhoun published in Proceedings of the Royal Society of Medicine what I regard as the classical study in the field. He built a large cage for mice with plenty of nesting places and material and assured there would be plenty of food and water; then he released four males and four females in the box. Hed observed their behavior and counted them periodically. Here is how the population changed over time.
J. Calhoun, Death squared: the explosive growth and demise of a mouse population. Proceedings of the Royal Society of Medicine 66, 80-88 (1973).
Obviously the population grew explosively until it reached two thousand mice. Then it grew more slowly to about two thousand. Then sometime between day 500 and day 600 all live births ceased, never to return. Unlike some previous data sets in which the size of the population had to be inferred from survivability or evidence of cook fires, these are counts in a laboratory. I should not have been sorry if the counts had been done more frequently, particularly around the beginning of the experiment, but the pattern is clear: one rise, one fall, extinction. Actually at the time indicated by the little arrow, he stopped counting the live mice and started counting the dead ones, and on day one thousand five hundred, ended the study; there had been no live births for a long time, and the mice were all too old to reproduce anyway. At one point after the last live birth he removed a few males and placed them with females known to be fertile. The males took no interest in the females, and there were no babies. In other words, males raised in the cage after a number of generations experienced absolute infertility. I am not sure whether it was post-zygotic (males hard wired for abnormal behavior) or pre-zygotic (sperm never getting to ova).
There may be a clue in their behavior, which he carefully described. For one thing, the mice promptly showed a preference for one corner of the cage, choosing to use nesting boxes there until all the boxes were filled and on the two adjacent sides the number of boxes occupied dropped steadily and continue to drop past the two corners. The corner farthest from the preferred corner never had any boxes occupied at all. The temptation is very strong to interpret this so mean that the mice were showing a preference of high status both in location choice and mating choices.
As the mice become more crowded most of the unattached males would stay gathered in the center of the cage. When one left to eat or get a drink of water it would be attacked when it returned. Some of the males – Calhoun calls them the “beautiful ones” neither competed for females nor entered the brawling world of the disappointed males. Instead they would get away from all the others and spend their time grooming. Again, there is a strong temptation to liken them to young urban male humans who, at a time for low reproductive rate, may largely withdraw from social contact. In the absence of valid numbers it seems hard to draw conclusions.
Now look again at the mouse plague data we saw before.
G. R. Singleton, C. J. Krebs, “The secret world of wild mice” in The Mouse in Biomedical Research, J. G. Fox, M. T. Davisson, F. W. Quimby, S. W. Barhold, C. E. Newcomer, A. L. Smith, Eds. (Elsever, Burlington, ed. 2, 2007), vol. 1, chap. 3, p. 39.
As I mentioned earlier, the populations tend to be small and stable in a fashion I have not had much success in getting my model to give. Since my source code is available through nobabies.net I invite anyone to have a go at it.
Something that is not conspicuous and possibly not present is the damped oscillation pattern shown by my fruit flies and by European voles. It may be hidden at the bottom, of course.
Then there is the double peak pattern I also described, which appears to be something that humans have a distinct tendency to follow. It seems odd that mice and humans share a pattern that we do not share with flies or voles. Voles, like mice, are rodents. Yet they do not share the same patterns, at least not conspicuously. We shall have to return to this point.
What is most conspicuous is the single peak pattern. Four times the data show huge populations that then crash. The authors make clear that even at the height of a plague the mice are never short on food. And available predators simply were not capable of eating enough mice to bring their numbers back down. The authors suggest there may be a virus affecting the mice, but that is only a matter of exclusion; they have ruled out everything else they can think of.
In normal times a male mouse will be very territorial, defending its little domain and its females most fiercely. But during a plague they seem to give up keeping all those others out; other males can pass with impunity.
What I suspect is that during the high population peaks, the fertility of the males drops to zero, just as in Calhoun’s cage. The rapid fall may be due to the fact that life in the wild is a lot more difficult than in the friendly cage. The males do not seem to be fighting each over to the death; injuries are no more frequent than at baseline. The brawling in the cage is not described among the plague mice, but surely the crowding even in the biggest plagues cannot be anything like the crowding in the cage.
I suspect the rapid fall is related to the behavior of Calhoun’s “beautiful ones.” If they can’t be bothered to defend their territory they may not put the effort in to scour around and find something to eat – something my mother used to call “survival value.” They may be starving in the midst of plenty.
I do not know; I only suspect. And I don’t have a suggestion of how to find out. But one thing is perfectly clear: the plague mice tend to show the same single peak curve as Calhoun’s mice.
Terror 19 Bateson
It is the 7th of April 2018. The chase is on to run down the mechanism for inbreeding depression and for what we may now call outbreeding depression. It is abundantly clear from the evidence that outbreeding depression will lead to extinction. As the renowned Professor Robin Fox said in a chapter title, “Marry in or Die Out.” (R. Fox, “Marry in or Die Out,” in Handbook on Evolution and Society (Paradigm Publishers, Boulder, 2015) p. 350.)
Patrick Bateson placed Japanese quail in cages where they could approach quail of the opposite sex visible through each window. The test bird, of either sex, and the choices were visible to each other, but different choices could not see each other. Bateson saw how much time a bird would spend near siblings from the same clutch of eggs, sibling that had been brought up together, cousins of different degree out to “unrelated,” which of course means very distantly related, birds. Here is what he found:
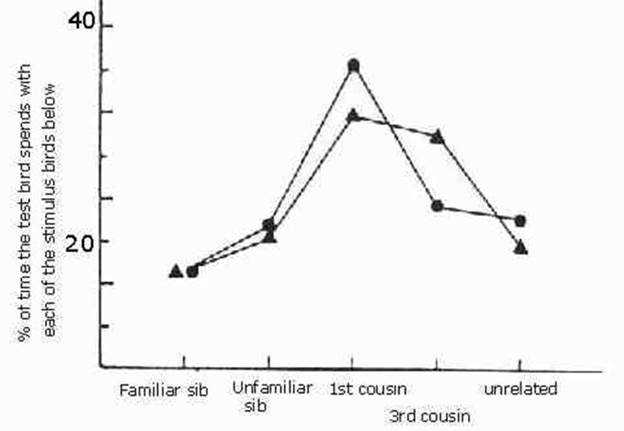
From Patrick Bateson Mate Choice (Cambridge University Press Cambridge 1983) One line gives the results for males being tested and the other for females.
Tragically, we have lost Bateson, but it was mentioned in his eulogy that he well understood the relationship between the preference of quail for relatives and the fertility boost this preference gave.
The preference for unfamiliar siblings over sibling nestmates is called the Westermark effect. It seems to be a defense against inbreeding, which we already know incurs a fertility penalty.
The quail follow the Sibly curve through some system of recognition even though they cannot know whether a newly met bird is a first or third cousin.
If these birds are not falling in love with relatives, they certainly are giving the appearance of doing so.
Terror 20 Sweden
Dore “Raven”
https://hyperallergic.com/102457/rediscovering-the-dark-splendor-of-gustave-dore-with-edgar-allan-poe/ downloaded Feb 18, 2018
It is the 9th of April 2018. The chase is still on to run down the mechanism for inbreeding depression and for outbreeding depression.
Another of my heroes we have lost recently has been Hans Rosling. He assembled an amazing amount of data about national statistics worldwide and posted the collection on the internet as gapminder.com Alas I cannot find it today, but it was very interesting to watch the statistics play out over time.
For about 30 years birth rates in rich countries have been somewhat below replacement levels and have been reasonably stable. That does not sound so scary. But is there any evidence that a fertility crash is sneaking up on us? Sure. Here is the experience of Sweden between 1955 and 2005 with the births per woman on the horizontal axis and age at first marriage on the vertical axis.

Taken from gapminder.com Each circle is a year. 1955 is where the label is. From there the trace wanders a bit but then fertility drops below 2 children per woman where it mostly remains. No sooner has the fall gone below replacement than the age at first marriage begins to rise. This is typical for developed countries; in some year, varying from country to country, fertility abruptly begins to fall, to go below replacement and then more or less to stabilize but with an immediate rise in age at first marriage for women.
Although fertility, as you can see here, may vary that probably only means that couples are choosing to have their babies sooner or later. We have already seen, most clearly in Iceland, that the actual total number of children is governed entirely by kinship issue.
On the other hand, once the marriage age starts upward, in the context of fertility below replacement, it never turns back. In fact, it never slows down. This is true of all the developed countries, and as we showed with the UN numbers, that means for the entirety of humankind that is visible in the statistics.
This give us the sad opportunity to determine when some country will suffer the fate of the Calhoun mice and experience total fertility collapse, again within the limits of what the statistics can show.
I worked with gapminder until I could list years from 1975 to 2005 and the age of marriage in each year. It rose from 24 to 32 during those 30 years or about one year’s delay for 3.75 calendar years. The graph shows eloquently how implacable is the advance.

1963 25
1964 24
1965 24
1966 24
1967 24
1968 24
1969 24
1970 24
1971 24
1972 24
1973 24
1974 24
1975 24
1976 24
1977 25
1978 25
1979 25
1980 25
1981 25
1982 25
1983 26
1984 26
1985 27
1986 27
1987 27
1988 27
1989 27
1990 28
1991 28
1992 28
1993 29
1994 29
1995 29
1996 30
1997 30
1998 30
1999 31
2000 31
2001 31
2002 32
2003 32
2004 32
2005 32
Assuming the pattern holds, the age of marriage in 2006 should be 33. I am making an assumption here that unmarried women are following the same trend and married women. If that is not true it could skew the results. I assume that by age 38 a woman’s ability to have children drops drastically as menopause approaches. And I am happy to leave out the statistics since 2005 since for several years there has been immigration into Sweden that again probably alters the actual numbers.
So from age 33 to menopause would be 5 years. 5 times 3.75 is 18.75; we’ll call it 19. 19 plus 2005 is 2024. That should be the year that fertility collapses. And in our mostly global culture, and since just about everybody in Sweden is in the productive middle class, that probably holds for the productive middle class worldwide. It will be hard to maintain our high tech civilization once the youngest productive people are fifty years old. The year 2074 may be a bad one.
I have no cure in mind. Maybe cloning will become cheap and safe. Some other fix might be discovered if we were to search diligently. But a simple change in mating strategy does not appear promising; those last fertile women are already among us and have already chosen their permanent partners.
Terror 21 Canada Trees

It is the 10th of April 2018. The depressing chase is still on to run down the mechanism for inbreeding depression and for outbreeding depression. In the last talk we were led to consider that possibility that in a very few years the birth rate for Sweden, and by extension the entire global productive middle class, would fall essentially to zero. This phenomenon had been suggested by history, archeology and plagues of wild mice and seen in laboratory mice. Prudence demands we look for the same thing elsewhere.
There have been studies of leaf cutting insects in Canada. The economic importance of such insects is obvious. What they have done has been to count the number of “leaders,” which means the shoots growing off the main stem of a tree, in infested trees that had insect eggs, the number of leaders that had been killed by the infestation and the average length of the leaders.
I should be happy to show you actual data, but what I have is a computer model they developed that gave a sort of idealized pattern. The horizontal axis is the age of the plantation being studied.
(14). 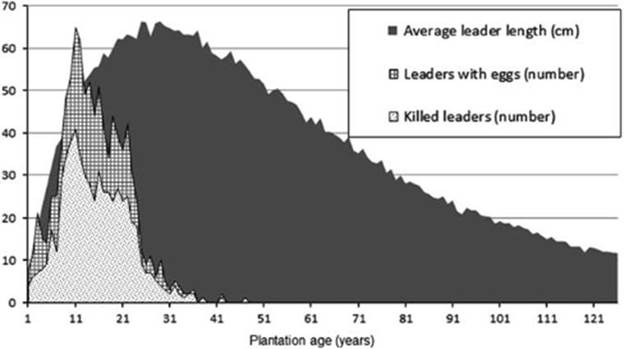
Detailed studies of the natural history of Pissodes strobi, and of the recovery and defect formation in its coastal host, Sitka spruce was used to develop a computer model, Spruce Results of the Spruce Weevil Attack (SWAT) simulation model showing the dynamics of weevil population, represented by the number of eggs laid on leaders and resulting damage (number of killed leaders) through the life of a Sitka spruce forest from plantation to harvest. In this model, weevil population is regulated by the availability of long leaders (a proxy for food supply), which are more prevalent during the juvenile stage of the stand. © 2015 Her Majesty the Queen in Right of Canada, as represented by Natural Resources Canada Insects affecting regenerating conifers in Canada: natural history and management René I. Alfaro,1 Alvaro Fuentealba Can. Entomol. Vol. 00, 2015
As they report, the number of insects during the first fifteen years or so is regulated by the food supply, the number of long leaders, offered by the trees. However, after that, although long leaders remain plentiful, the numbers of insects drop. The population is then being regulated by Something Else, which I believe to be infertility that is a consequence of the large number of mating insects.
And just as we suspect in Sweden, the population rises swiftly, falls rapidly – the fast up and slower down pattern seen in my laboratory fruit flies and the computer model – seems to be leveling off a bit and then dies out. After about year 50 there are no more eggs nor dead leaders.
In isolation one might well conclude that the infested trees are able to produce some chemical that protects them. However, since the same pattern occurs elsewhere, in rich countries where food is plentiful and wholesome, the behavior of these insects strongly supports our suspicion that his will happen to humans in developed countries, with other countries coming along several years later.
The effort I made to predict the time course in humans could be wildly off – I don’t know about the future, having never been there – and I certainly hope so. Given enough time, we might be able to avert disaster.
In the next talk I shall turn to a happier note: the reproductive success of some black footed ferrets re-introduced in the wild.
Terror 22 Black footed ferrets
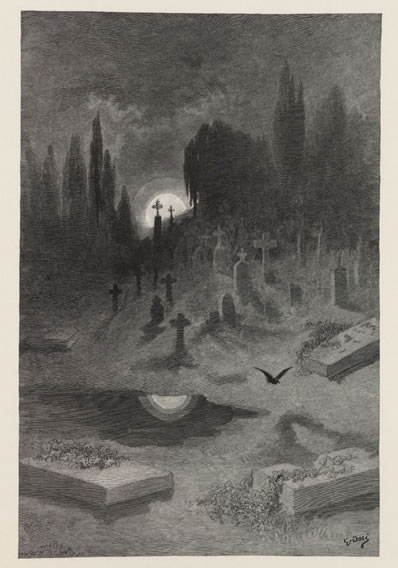
Dore “Raven”
https://hyperallergic.com/102457/rediscovering-the-dark-splendor-of-gustave-dore-with-edgar-allan-poe/ downloaded Feb 18, 2018
It is the 12 of April 2018. Don’t let the title or lead image mislead you. This is a happier one. It’s a success story. We are not in dire peril from black footed ferrets. Maybe we can learn from them one day.
There was a time when the black footed ferret was extinct in the wild but still thrived in captivity. Measures had been taken that would have assured the survival of these weasels, but there were none left in the wild to protect. So over 4 years, 1991 through 1994 inclusive, captivity bred ferrets were released, a few dozen a year. At first it didn’t seem to be going well. The animals known to be living in the wild did not increase in number so the program was stopped. By 1997 they gave up counting the few stragglers.
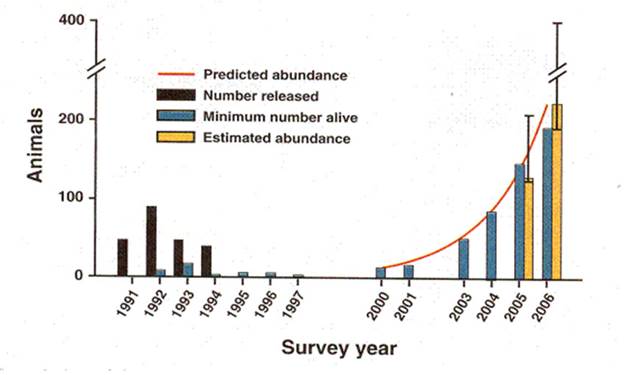
Rapid Population Growth of a Critically Endangered Carnivore. M. B. Grenier, D. B. Macdonald and S. W. Buskirk SCIENCE volume 317 10 August 2007 page 779 figure 1. The vertical black bars are the number of black footed ferrets released. The vertical grey bars are the number counted. Years of release or counting are along the horizontal axis.
Then in 2000 they did another count and found that there were still ferrets out there. It had been six years since the last release, and those had done poorly over the years they were counted. And now the growth of the population was very vigorous indeed.
I wasn’t there, and they did not mention it, but I would assume that care was taken to assure a lot of Genetic Diversity among the released animals because that is a Good Thing. I’m sure you understand my sarcasm and hope you can forgive it.
In the early days after the study I watched a program on the collapsing birth rate worldwide. I wrote all of the authors and only one responded. He seemed to think there was no such thing. He new about the black footed ferret experience, so I pointed out that the explosive growth was not seen for some three to six years after the last release; all he could see was “exponential growth.”
At last he gave up on me. Hmm. Exponential growth, eh? Let’s look a little closer. There is a red line that shows a fair exponential growth curve and has been fitted by computer to give a best match. Were growth truly exponential, the line would fit the tops of the grey bars perfectly, give or take noise. But in fact, at the far left, the bars lie below the exponential growth curve, at or above it in the middle and then back to below at the end.
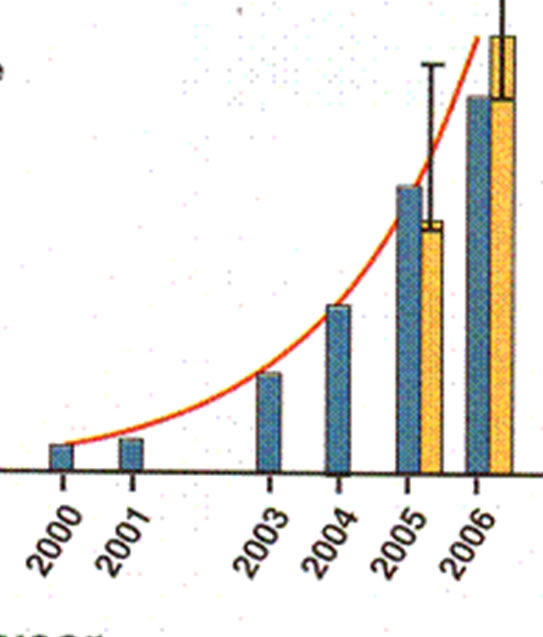
Sure, it’s a trifling difference. But I pulled one of my computer runs and selected a time when the virtual population was undergoing superficially exponential growth. I calculated for each generation the percentage change in population size over the previous generation. True exponential growth of course would have given bars that were all the same height. Instead,
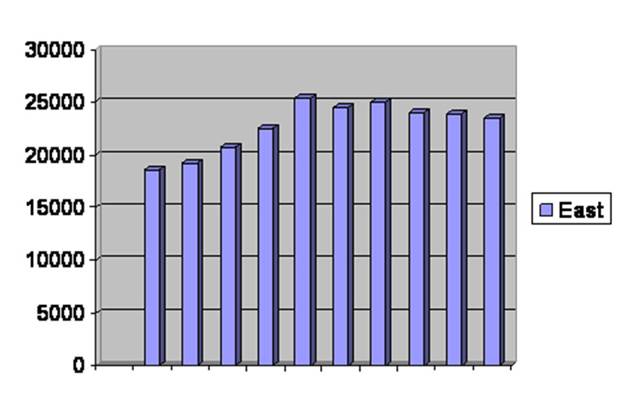
Offspring per parent in the computer simulation during rapid growth. Vertical axis is offspring per parent. Horizontal axis is generations.
There is a vote for my computer simulation of the underlying epigenetic process being on the right track.
But the payoff, the really good news is this: in 2006 they noticed that the ferrets, having reached a size of between 200 and 300 individuals were beginning to break up the original colony and move out to establish new colonies. They declared a victory for the operation and reported no further counts in the article.
So what was the course of events? For 4 years the team, with the best of intentions, kept throwing in new ferrets insufficiently related to each other and to the previous year’s crop. Then they gave up and stopped punishing the little beasts. Left on their own, the ferrets sorted it out (no problem with food; they eat prairie dogs, which are not so rare thereabouts one must assume) formed a community of excellent size AND appropriate diversity, and began to take over the world.
So it can be done. It has been done. Significant damage from outbreeding is not necessarily lethal. Don’t I wish I knew how to get from here to there, maybe without even losing all the treasures of civilization.
Terror 23 Source Code

It is the 12 of April 2018.
This computer program is technically THE THEORY that impacts so many disciplines making quantitative or semi quantitative predictions.
I don’t know about you, but this is the talk I personally have been dreading. What you see in red is me talking to you. What you see in black is what I am talking about, Ok? Links should be a different color. If you want the source code without these ramblings, go to
http://nobabies.net/Source%20code%20for%20kinship%20and%20fertility%20part%201.html
First read this,
Source code for kinship and fertility
This will include the C++ source code, a blank work sheet for more work and then a summary, which will include parameters used for the runs described in “Kinship governs fertility with pre- and post-zygotic mechanisms mediated by match of methylation patterns” You may have to do some tweaking. https://www.biorxiv.org/search/Kinship%252Bgoverns%252Bfertility%252Bwith%252Bpre-%252Band%252Bpost-zygotic%252Bmechanisms%252Bmediated%252Bby%252Bmatch%252Bof%252Bmethylation%252Bpatterns%252B%252B, and an example of a saved population. Just for fun I put in notes from the search.
SOURCE CODE (Microsoft visual C++ 6.0)
and then download this, but first a word about reading source code. The “machine code” or “executable code” is not readable by me. Instead I work with the source code, which is converted by a “compiler” program into executable. Within the source code, some of the sentences are directed toward the machine and some to any interested program. The latter is the “commentary” or “documentation.” It should read off like a novel. If it is less than a line long, the line begins double slash, “//” and ends with “enter.” A long comment is placed between a slash star /* and star slash */. Read that part with gratitude. The machine’s version is what is left. In the C++ language I use it is a kind of a long run-on sentence, each clause ending in a semicolon “;” and without necessarily a capital in the beginning nor period at the end.
So we start with the first comment:
/* This is a program to simulate the behavior of a population that is limited in size by
decreasing fertility with greater size and less kin members on average. The program models
the genetic makeup of the population. Genetic is to be understood in the broadest possible
sense to include epigenetic effects or any other inheritable factor. This program is named
"Accumulating" for "Accumulating infertility."
First we load our tools.*/
#include <iostream>//Loading the software tools. This f’rinstance is part of what can move things in and out of the programs.
#include <iomanip>
#include <cmath> //Bet you guessed this prepares the program to do things like arithmetic.
#include <cstdlib>
#include <fstream>
#include <ctime>
using std::ios;
using std::ofstream;
using std::ifstream;
using std::cout;
using std::cin;
// Next the variables. I try to give names related to what the variables are. “int” means integers, Max is maximum, sims means generatons Pop means population, init means initial and s forth.
int RunNumber;
int MaxSims;
int Sims;
int MaxGens;
int Gens;
int MaxProgeny;
int OffspringComing;
int maxprogeny;
int InitPopSize;
int initpopsize;
int MaxPopSize;
int PopSize = 0;
int InNextGeneration;
long TopofHeap;
int Genes;
long GeneMutRate;
int PreZsites;
long PreZMutRate;
long PreZImpact;
int PostZsites;
long PostZMutRate;
long PostZImpact;
int AddFile;
int Incoming;
int incoming;
long ID;
long Arrow;
long Dart;
int slot;
int Mate;
long FickleFinger;
long Chance;
int Courting;
long coin;
long Coin;
int Lethal;
long Loss;
long MisMatch;
long mismatch;
long PreZInfertility;
long PostZInfertility;
int Delay;
int delay;
long AccumulatedInfertility;
int NotLastRun = 1;
int End;
//Then we establish the arrays. These are limited by RAM. With modern equipment they’d be a lot bigger.
long Population[1000][542];
long CurrentMate[542];
long OtherMate[542];
long Offspring[542];
long NextGeneration[100000][542];
int EndPopulations[101];
long FinalGenerations[100];
long PopHistory[1000000];
long main (long)
{//1 Main
// This is probably a good moment to start the random numbers. They won’t be big enough for our needs, so we’ll be fudging later.
srand(time(0));
// We let the user put his choices in.
RunNumber = 0;
cout << "\n What will be the number to identify this run?\n";
cin >> RunNumber;
MaxSims = 101;
cout << "\n How many simulations do you want to run? Don't go over 100. \n";
while (MaxSims > 100)
{//2 Choose MaxSims
cin >> MaxSims;
}//2 Choose MaxSims
MaxGens = 1000001;
while (MaxGens > 1000000)
{//3 Choose MaxGens
cout << "\n Up to how many generations will each simulation last?\n";
cout << "\n Don't go over 1,000,000. No commas.\n";
cin >> MaxGens;
}//3 Choose MaxGens
MaxProgeny = 201;
while(MaxProgeny>200)
{//4 Choose MaxProgeny
cout << "\n How many offspring maximum can one pair have? (200 is the maximum.)\n";
cin >> MaxProgeny;
}//4 Choose MaxProgeny
maxprogeny = MaxProgeny;
InitPopSize = 1001;
while(InitPopSize>1000)
{//5 Choose InitPopSize
cout << "\n What size will your initial population be? \n";
cout << "\n 100 would be a good start.\n Don't go over 1,000. No comma.\n";
cin >> InitPopSize;
}//5 Choose InitPopSize
initpopsize = InitPopSize;
MaxPopSize = 1001;
while(MaxPopSize>1000)
{//6 Choose MaxPopSize
cout << "\n What will your maximum population be? Don't go over 1,000. \n";
cout << "\n Don't use commas.\n";
cin >> MaxPopSize;
}//6 Choose MaxPopSize
Genes = 51;
while(Genes > 50)
{//7 Choose Genes
cout << "\n How many gene pairs subject to recessive lethal mutations? \n";
cout << "\n Don't go over 50.\n";
cin >> Genes;
}//7 Choose Genes
GeneMutRate = 100001;
while(GeneMutRate > 100000)
{//8 Choose GeneMutRate
cout <<"\n How many genetic mutations per site per 100,000 generations? \n";
cout << "\n Don't go over 100,000. \n";
cin >> GeneMutRate;
}//8 Choose GeneMutRate
PreZsites = 101;
while(PreZsites > 100)
{//9 Choose PreZsites
cout << "\n How many sites will affect pre zygotic fertility? \n";
cout << "\n Don't go over 100.\n";
cin >> PreZsites;
}//9 Choose PreZsites
PreZMutRate = 100001;
while(PreZMutRate > 100000)
{//10 Choose PreZMutRate
cout << "\n What change rate per site per 100,000 generations? \n";
cout << "\n Don't go over 100,000.\n";
cin >> PreZMutRate;
}//10 Choose PreZMutRate
PreZImpact = 100001;
while(PreZImpact > 100000)
{//11 Choose PreZImpact
cout << "\n How many thousandths of 1 offspring will a unit of mismatch result \n";
cout << "\n in losing. 500 would have a 50% chance of losing one. \n";
cout << "\n Don't go over 100,000.\n";
cin >> PreZImpact;
}//11 Choose PreZImpact
PostZsites = 101;
while(PostZsites > 100)
{//12 Choose PostZsites
cout << "\n How many sites will affect post zygotic fertility? \n";
cout << "\n Don't go over 100.\n";
cin >> PostZsites;
}//12 Choose PostZsites
PostZMutRate = 100001;
while(PostZMutRate > 100000)
{//13 Choose PostZMutRate
cout << "\n What change rate per site per 100,000 generations? \n";
cout << "\n Don't go over 100,000.\n";
cin >> PostZMutRate;
}//13 Choose PostZMutRate
PostZImpact = 100001;
while(PostZImpact > 100000)
{//14 Choose PostZImpact
cout << "\n How many thousandths of 1 offspring will a unit of mismatch result\n";
cout << "\n in losing. 500 would have a 50% chance of losing one. \n";
cout << "\n Don't go over 100,000.\n";
cin >> PostZImpact;
}//14 Choose PostZImpact
Delay = 21;
while(Delay > 20)
{//102 Choose Delay
cout << "\n The program will let post zygotic infertilty accumulate for up to 20\n";
cout << "\n generations. Choose at least 1 for any effect. Don't go over 20.\n";
cin >> Delay;
}//102 Choose Delay
AddFile = 0;
cout << "\n As the program runs, the screen will print out the number of offspring\n";
cout << "\n each generation. Do you wish to add a file? 1 for yes, 0 for no. \n";
cout << "\n Don't add more than are saved or more than there is room for. \n";
cin >> AddFile;
if(AddFile == 1)
{//15a Add file
cout << " How many? File should be saved on drive C as InPop.\n";
cin >> Incoming;
}//15a Add file
else
{//15b Add no file
}//15b Add no file
cout << "\n";
//We start running the simulations. By this time the user is no doubt heartily sick of it.
Sims = 1;
while(Sims<=MaxSims)
{//Begin Sims.//16 Sims
if(ID>1000000) //We make sure not to overrun ID.
{//17a Reset ID
ID = 0;
}//17a Reset ID
else
{//17b Don't reset ID
}//17b Don't reset ID
//We create a population. And so forth… from here on in the documentation should carry you.
PopSize = 0;
while(PopSize < InitPopSize)
{//Begin create population.//18 Create population
Population[PopSize][0] = ID;
ID = ID + 1;
Population[PopSize][1] = 0;
Arrow = 541;
while(Arrow >= 1)
{//19 Zero out array
Population[PopSize][Arrow] = 0;
Arrow = Arrow - 1;
}//19 Zero out array
PopSize = PopSize + 1;
}//End create population.//18 Create population
//We import a population.
if(AddFile == 1)
{// Begin import files. //20a Import population
incoming = Incoming;
ifstream File("C:\\InPop", ios:: in);
while(incoming > 0)
{//21 Importing
Arrow = 0;
while(Arrow<=541)
{//22 Copy one
File >> slot;
Population[PopSize][Arrow] = slot;
Arrow = Arrow + 1;
}//22 Copy one
Population[0][PopSize] = ID;
ID = ID + 1;
PopSize = PopSize + 1;
incoming = incoming - 1;
}//21 Importing
File.close();
}// End import files.//20a Import population
else //We do not import from a file.
{//20b Don't import
}//20b Don't import
//Begin running generations.
Gens = 1;
while(Gens <= MaxGens)
{//Begin Generations.//23 Gens
Mate = 0;
InNextGeneration = 0;
while(PopSize > 1)
{//Begin running the population.//24 Run pop
if (Mate == 0)
{//Begin find mates.//25a Find mates
//We take the first mate.
Arrow = 541;
while(Arrow>=0)
{//Begin copy current mate.//26 Copy current mate
TopofHeap = PopSize - 1;
CurrentMate[Arrow] = Population[TopofHeap][Arrow];
Arrow = Arrow - 1;
}//End copy current mate.//26 Copy current mate
//We take another mate from what is left.
TopofHeap = TopofHeap - 1;
if(TopofHeap == 0)
{//27a Out of mates
Courting = 0;
}//27a Out of mates
else
{//27b Find a mate
TopofHeap = TopofHeap + 1;
FickleFinger = rand()*rand();
Courting = FickleFinger % TopofHeap;
}//27b Find a mate
Arrow = 541;
while(Arrow>=0)
{//Begin copy other mate.//28 Copy other mate
OtherMate[Arrow] = Population[Courting][Arrow];
//Fill the place where other mate was.
Population[Courting][Arrow] = Population[TopofHeap][Arrow];
Arrow = Arrow - 1;
}//End copy other mate.//28 Copy other mate
Mate = 1;
}//End find mates.//25a Find Mates
else
{//Begin make many offspring.//25b Make many offspring
OffspringComing = MaxProgeny;//We allow for infertility starting
//with pre zygotic. Getting into the heart of it now.
//We calculate pre zygotic infertility.
if (PreZsites> 0 )
{//29a PreZsites > 0
Arrow = 50 + PreZsites;
Dart = 320 + PreZsites;
MisMatch = 0;
mismatch = 0;
while(Arrow > 100)
{//30 Count PreZsites
mismatch = Offspring[Arrow] - Offspring[Dart] ;
if(mismatch < 0)
{//31a Change to positive
mismatch = mismatch * -1;
}//31a Change to positive
else
{//31b Leave positive
}//31b Leave positive
MisMatch = MisMatch + mismatch;
mismatch = 0;
Arrow = Arrow - 1;
Dart = Dart - 1;
}//30 Count PreZsites
PreZInfertility = 0;
Loss = PreZImpact * MisMatch;
if(Loss >= 1000)
{//32a Lower fertility one offspring at a time
while(Loss >= 1000)
{//33
PreZInfertility = PreZInfertility +1;
Loss = Loss - 1000;
}//33
}//32a Lower fertility one offspring at a time
else
{//32b No whole offspring lost
}//32b No whole offspring lost
coin = rand();
Coin = coin % 1000;
if(Loss > Coin)
{//34a Lose fractional offspring
PreZInfertility = PreZInfertility + 1;
}//34a Lose fractional offspring
else
{//34bKeep fractional offspring
}//34b Keep fractional offspring
OffspringComing = OffspringComing - PreZInfertility;
}//29a PreZsites > 0
else
{//29b PreZsites = 0
}//29b PreZsites = 0
//Then we take out the post zygotic infertility of each parent.
OffspringComing = OffspringComing - CurrentMate[541];
OffspringComing = OffspringComing - OtherMate[541];
if(OffspringComing >0)
{//35a If making offspring
while(OffspringComing > 0)
{//Make one offspring. //36Make one offspring
Offspring[0] = ID;
ID = ID + 1;
coin = rand();
Coin = coin % 2;
if(Coin == 1)
{//Begin copy one chromosome.//37a Copy one chromosome
Arrow = 270;
while(Arrow > 0)
{//38 Copy
Offspring[Arrow] = CurrentMate[Arrow];
Arrow = Arrow - 1;
}//38 Copy
}//37a Copy one chromosome
else
{//37b Copy other chromosome
Arrow = 270;
Dart = 540;
while(Arrow > 0)
{//39 Copy
Offspring[Arrow] = CurrentMate[Dart];
Arrow = Arrow - 1;
Dart = Dart - 1;
}//39 Copy
}//End copy one chromosome.//37b Copy other chromosome
coin = rand();
Coin = coin % 2;
if(Coin == 1)
{//Begin copy second chromosome//40a Copy second chromosome
Arrow = 540;
while(Arrow > 270)
{//41 Copy
Offspring[Arrow] = OtherMate[Arrow];
Arrow = Arrow - 1;
}//41 Copy
}//40a Copy second chromosome
else
{//40b Copy other second
Arrow = 540;
Dart = 540;
while(Arrow > 270)
{//42 Copy
Offspring[Arrow] = OtherMate[Dart];
Arrow = Arrow - 1;
Dart = Dart -1;
}//42 Copy
}//End copy second chromosome.40b Copy other second
//We check to see if there are matched recessive lethals.
Arrow = 50;
Dart = 320;
Lethal = 0;
while(Arrow > 0)
{//Check for lethal.//43 Check for lethal
if(Offspring[Arrow] + Offspring[Dart] > 1)
{//44a Lethal
Lethal = 1;
}//44a Lethal
else
{//44b Not Lethal
}//44b Not Lethal
Arrow = Arrow - 1;
Dart = Dart - 1;
}//43 Check for lethal
if(Lethal == 1)
{//45a Lose one offspring
OffspringComing = OffspringComing - 1;
}//End check for lethal//45a Lose one offspring.
else
{ //We continue .//45b Continue with offspring
OffspringComing = OffspringComing -1;
//We mutate the genes.
if(GeneMutRate > 0)//Begin mutate genes.
{//46a Mutate Genes
Arrow = 0 + Genes;
while(Arrow > 0)
{//47 Mutate one
FickleFinger = rand() * rand();
Chance = FickleFinger % 100000;
if(GeneMutRate > Chance)
{//48a change
Offspring[Arrow] = 1;
}//48a change
else
{//48b Don't change
}//48b// Don't change
Arrow = Arrow - 1;
}//47 Mutate one
Arrow = 270 + Genes;
while(Arrow > 270)
{// 49 Mutate other
FickleFinger = rand() * rand();
Chance = FickleFinger % 100000;
if(GeneMutRate > Chance)
{//50a Change
Offspring[Arrow] = 1;
}//50a Change
else
{//50b Don't change
}//50b Don't change
Arrow = Arrow -1;
}// 49 Mutate other
}//46a Mutate Genes
else
{//46b Don't mutate Genes
}//End mutate // genes.//46b Don't mutate Genes
//We mutate the PreZsites.
if(PreZsites > 0)
{//Begin mutate PreZsites. //51a Mutate PreZsites
Arrow = 50 + PreZsites;
while(Arrow>50)//Mutate first PreZsites segment.
{//52 Count PreZsites one
FickleFinger = rand() * rand();
Chance = FickleFinger % 100000;
if(PreZMutRate > Chance)
{//53a Change
coin = rand();
Coin = coin % 2;
if(Coin = 1)
{//54a Increase
Offspring[Arrow] = Offspring[Arrow] + 1;
}//54a Increase
else
{//54b Decrease
Offspring[Arrow] = Offspring[Arrow] - 1;
}//54b Decrease
}//53a Change
else
{//53b Don't change
}//53b Don't change
Arrow = Arrow - 1;
}//52 Count PreZsites one
Arrow = 320 +PreZsites;
while(Arrow>320)//Mutate other PreZsites segment.
{//55 Count PreZsites two
FickleFinger = rand() * rand();
Chance = FickleFinger % 100000;
if(PreZMutRate > Chance)
{//56a Change
coin = rand();
Coin = coin % 2;
if(Coin == 1)
{//57a Increase
Offspring[Arrow] = Offspring[Arrow] + 1;
}//57a Increase
else
{//57b Decrease
Offspring[Arrow] = Offspring[Arrow] - 1;
}//57b Decrease
}//56a Change
else
{//56b Don't change
}//56b Don't change
Arrow = Arrow - 1;
}//55 Count PreZsites two
}//51a Mutate PreZsites
else
{//51b Don't mutate PreZsites
}//51b Don't mutate PreZsites
//End mutate PreZsites.
//We mutate the PostZsites.
if(PostZsites > 0)
{//Begin mutate PostZsites.//58a Mutate PostZsites
Arrow = 150 + PostZsites;
while(Arrow>150)//Mutate first PostZsites segment.
{//59 Count PostZsites one
FickleFinger = rand() * rand();
Chance = FickleFinger % 100000;
if(PostZMutRate > Chance)
{//60a Change
coin = rand();
Coin = coin % 2;
if(Coin = 1)
{//61a Increase
Offspring[Arrow] = Offspring[Arrow] + 1;
}//61a Increase
else
{//61b Decrease
Offspring[Arrow] = Offspring[Arrow] - 1;
}//61b Decrease
}//60a Change
else
{//60a Don't change
}//60a Don't change
Arrow = Arrow - 1;
}//59 Count PostZsites one
Arrow = 420 +PostZsites;
while(Arrow>420)//Mutate other PostZsites segment.
{//62 Count PostZsites two
FickleFinger = rand() * rand();
Chance = FickleFinger % 100000;
if(PostZMutRate > Chance)
{//63a Change
coin = rand();
Coin = coin % 2;
if(Coin == 1)
{//64a Increase
Offspring[Arrow] = Offspring[Arrow] + 1;
}//64a Increase
else
{//64b Decrease
Offspring[Arrow] = Offspring[Arrow] - 1;
}//64b Decrease
}//63a Count PostZsites two
else
{//63b Don't change
}//63b Don't change
Arrow = Arrow - 1;
}//62 Count PostZsites two
}//58a Mutate PostZsites
else
{//58b Don't mutate PostZsites
}//58b Don't mutate PostZsites
//End mutate PostZsites.
if (PostZsites >0)//We calculate post zygotic
//infertility. This is counter-intuitive. It was the biggest hurdle. Be careful.
{Arrow = 150 + PostZsites;//65a Use PostZsites
Dart = 420 + PostZsites;
MisMatch = 0;
mismatch = 0;
while(Arrow > 150)
{//66 Count PostZsites
mismatch = Offspring[Arrow] - Offspring[Dart] ;
if(mismatch < 0)
{//67a Change to positive
mismatch = mismatch * -1;
}//67a Change to positive
else
{//67b Leave positive
}//67b Leave postive
MisMatch = MisMatch + mismatch;
mismatch = 0;
Arrow = Arrow - 1;
Dart = Dart - 1;
}//66 Count PostZsites
PostZInfertility = 0;
Loss = PostZImpact * MisMatch;
if(Loss > 1000)
{//68a Lose whole offspring
while(Loss > 1000)
{//69 Lose one
PostZInfertility = PostZInfertility +1;
Loss = Loss - 1000;
}//69 Lose one
}//68a Lose whole offspring
else
{//68b No whole offspring lost
}//68b No whole offspring lost
coin = rand();
Coin = coin % 1000;
if(Loss > Coin)
{//70a Lose fractional offspring
PostZInfertility = PostZInfertility + 1;
}//70a Lose fractional offspring
else
{//70b Keep fractional offspring
}//70b Keep fractional offspring
Arrow = 251;
Dart = 252;
while (Arrow < 270)
{//103 Shuffle in post zygotic infertility
Offspring[Arrow] = Offspring[Dart];
Arrow = Arrow + 1;
Dart = Dart + 1;
}//103 Shuffle in post zytotic infertility
Offspring[270] = PostZInfertility;// Top off this chromosome
Arrow = 521;
Dart = 522;
while (Arrow < 540)
{//103 Shuffle in post zygotic infertility
Offspring[Arrow] = Offspring[Dart];
Arrow = Arrow + 1;
Dart = Dart + 1;
}//103 Shuffle in post zytotic infertilty
Offspring[540] = PostZInfertility;// Top off this other chromosome
//Add up delayed infertiltiy.
AccumulatedInfertility = 0;
delay = Delay;
Arrow = 271 - Delay;
while (Arrow < 271)
{//104//Count 1 chromosome
AccumulatedInfertility = AccumulatedInfertility = Offspring[Arrow];
Arrow = Arrow + 1;
}//104//Count 1 chromosome
Arrow = 541 - Delay;
while (Arrow < 541)
{//105//Count other chromosome
AccumulatedInfertility = AccumulatedInfertility = Offspring[Arrow];
Arrow = Arrow + 1;
}//105//Count other chromosome
Offspring[541] = AccumulatedInfertility;//And put it in its place
}//65a Use PostZsites
else
{//65b Don't use PostZsites
}//65b Don't use PostZsites
//Transfer offspring to next generation.
Arrow = 541;
while(Arrow>=0)
{//71 Transfer offspring
NextGeneration[InNextGeneration][Arrow] = Offspring[Arrow];
Arrow = Arrow - 1;
}//71 Transfer offspring
InNextGeneration = InNextGeneration + 1;
}//45b Continue with offspring
}//36 Make one offspring OK, it’s downhill from here.
Mate = 0;
PopSize = PopSize - 2;
}//35a If making offspring
else
{//35b Finish making offspring
Mate = 0;
PopSize = PopSize - 2;
}//35b Finish making offspring
}//End make many offspring.//25b Make many offspring
}//End running the population. //24 Run pop
cout << InNextGeneration << " ";//We report total offspring this
//generation to screen and array.
PopHistory[Gens] = InNextGeneration;//72 Write to array
if(Gens==MaxGens)
{//73a Record last PopSize and Gens run
NotLastRun = 0;//We stop recording offspring to the array.
EndPopulations[Sims] = InNextGeneration;//We record last offsping and
//last generation number for this simulation.
FinalGenerations[Sims] = Gens;
}//73a Record last PopSize and Gens run
else
{//73b Not yet
}//73b Not yet
//We transfer the new population.
if(InNextGeneration <2)//We see if the population has crashed.
{//74a If pop crashed prepare to shut down.
FinalGenerations[Sims] = Gens;
Gens = MaxGens;
}//74a If pop crashed prepare to shut down.
else
{//We prepare for a new cycle.//74b Prepare new cycle.
if(InNextGeneration <= MaxPopSize)//We transfer all of the population.
{//75a Transfer whole pop
Dart = InNextGeneration - 1;
PopSize = 0;
while(Dart >= 0)
{//76 Count down pop
Arrow = 541;
while(Arrow >= 0)
{//77 Transfer
Population[PopSize][Arrow] = NextGeneration [Dart][Arrow];
Arrow = Arrow - 1;
}//77 Transfer
PopSize = PopSize + 1;
Dart = Dart - 1;
}//76 Count down pop
}//75a Transfer whole pop
else//We transfer some of the population.
{//75b Transfer some pop
PopSize = 0;
TopofHeap = InNextGeneration - 1;
while(PopSize < MaxPopSize)
{//78 Count down pop
Arrow = 541;
FickleFinger = rand() * rand();
Dart = FickleFinger % InNextGeneration;
while (Arrow >= 0)
{//79 Transfer
Population[PopSize][Arrow] = NextGeneration[Dart][Arrow];
NextGeneration[Dart][Arrow] = NextGeneration[TopofHeap][Arrow];
Arrow = Arrow - 1;
}//79 Transfer
PopSize = PopSize +1;
TopofHeap = TopofHeap -1;
}//78 Count down pop
}//75b Transfer some pop
}//74b Prepare new cycle.
Gens = Gens +1;
}//End Generations. //23 Gens
cout << " Simulation " << Sims << " done. \n";
Sims = Sims + 1;
}//End Sims. //16 Sims
cout << "\n The final populations in the simulations were: " // Now we wrap it up, crow and document.
Arrow = 1;
while(Arrow <= MaxSims)
{//80 Print final pop to screen
cout << EndPopulations[Arrow] << " ";
Arrow = Arrow + 1;
}//80 Print final pop to screen
cout << "\n\n The number of generations run in the simulations were: ";
Arrow = 1;
while(Arrow <= MaxSims)
{//81 Print gens each Sim to screen
cout << FinalGenerations[Arrow] << " ";
Arrow = Arrow + 1;
}//81 Print gens each Sim to screen
ofstream Summary("C:\\Summary",ios :: out);
Summary << " Summary \n\n The run number was " << RunNumber
<< ". The number of Simulations was " << MaxSims
<< ". The parameters were: Maximum generations "
<< MaxGens << " . Maximum offspring " << MaxProgeny << ". Initial population "
<< InitPopSize << ". Maximum Population " << MaxPopSize
<< ". Number of gene pairs subject to recessive lethal mutations "
<< Genes << ". Mutation rate of the genes " << GeneMutRate
<< ". Number of sites affecting pre zygotic fertility was " << PreZsites
<< ". Change rate at each site was " << PreZMutRate
<< " per site per 100,000 generations. Number of thousandths of an offspring "
<< "lost per unit of mismatch was " << PreZImpact
<< ". Number of sites affecting post zygotic fertility was " << PostZsites
<< ". Change rate for the sites affect post zygotic fertility was "
<< PostZMutRate << " per site per 100,000 generations. "
<< "The number of thousandths of offspring lost per unit of mismatch was "
<< PostZImpact << ". Infertility accumulated for " << Delay
<< " generations. A file was added. (1 for yes, 0 for no.) " << AddFile
<< ".\n\n The offspring in the final population(s) of the(each) "
<< "simulation was(were): ";
Arrow = 1;
while(Arrow <= MaxSims)
{//82 Send final pops to summary
slot = EndPopulations[Arrow];
Summary << slot << " ";
Arrow = Arrow + 1;
}//82 Send final pops to summary
Summary << ".\n\n The generation(s) run by the(each) simulation was(were): ";
Arrow = 1;
while(Arrow <= MaxSims)
{//83 Send final Gens per Sim to summary
slot = FinalGenerations[Arrow];
Summary << slot << " ";
Arrow = Arrow + 1;
}//83 Send final Gens per Sim to summary
Summary << "\n\n The numbers of offspring in each generation of the last simulation"
<<" were: ";
Arrow = 1;
while(Arrow <= MaxGens)
{//Send offpring each Gen in last Sim
slot = PopHistory[Arrow];
Summary << slot << " ";
Arrow = Arrow + 1;
}//Send offpring each Gen in last Sim
Summary.close();
cout << "\n\n The program will save a summary of the run as Summary. It is also "
<< "able to save your remaining population as RemainingPop. Files are saved "
<< "on drive C. \n Do you wish to save a population? 1 for yes, 0 for no.\n";
cin >> Coin;
if(Coin == 0)
{//85a No pop saved
}//85a No pop saved
else
{//85b Save a population
cout << " How many do you want to save? Don't go over " << PopSize << ".\n";
cin >> Incoming;
ofstream OutFile("C:\\RemainingPop",ios :: out);
Dart = Incoming - 1;
Arrow = 0;
while(Dart >= 0)
{//86 Count down members
while(Arrow <= 541)
{//87 Count one member
slot = NextGeneration[Dart][Arrow];
OutFile << slot << " ";
Arrow = Arrow + 1;
}//87 Count one member
Dart = Dart - 1;
Arrow = 0;
}//86 Count down members
OutFile.close();
cout << "\n\n The key to reading Remaining Pop is:the first number is generally "
<< "a very large one and is the ID number for that individual. Then 2 "
<< "through 51 are genes on the first chromosome; 52 through 151 pre "
<< "zygotic sites on that chromosome. 152 through 251 post zygotic sites; "
<< "252 through 271are the accumulating generations of infertilty on that "
<< "chromosome and then 272 - 321 genes, 322 - 421 pre, 422 - 521 post, 522 - 541 "
<< "accumulating infertilty on the other. 542 is post zygotic infertilty. /n/n";
}//85b Save a population
cout << "\n Enter any number to finish. \n";
cin >> End;
return 0;
}//1 Main
If you are still here, congratulations. You are made of stern stuff. Now get busy and save the world; even if there is enough time, there’s none to spare.
Terror 24 Pre and Post Zygotic Curves
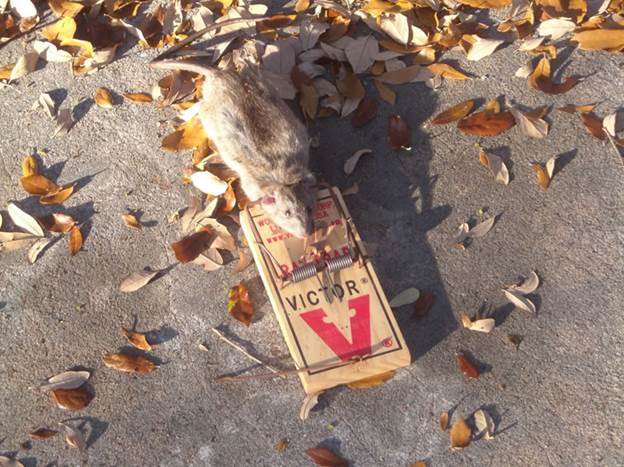
It is the 15th of April of 2018.
Ovum and sperm combine to form a “zygote” which is a single cell that goes on to form an embryo and then fetus and certain tissues that will support the pregnancy. Anything that prevents that formation of a zygote is “pre-zygotic” infertility, while anything that prevents the pregnancy from going on to have offspring is “post-zygotic.”
Since this is a cyclic process the question inevitably arises, “When does a post-zygotic process of one generation become a pre-zygotic process of the next?” If I can’t get a date, is that pre- or post-? For me, the moment is when the sperm makes physical contact with the ovum. Anything before that instant is post-zygotic from the prior generation. However, if somebody has a different opinion, I am certainly interested in listening. On the other hand, spend a few minutes looking back over the source code and you will see that in the computer program, the two are not different facets of the same process. They do not occur together during the creation of a new generation.
Intuitively, one might expect that pre-zygotic should precede post-zygotic, but when I am thinking about it, I generally consider post-zygotic first. And so we shall.
So how does the post-zygotic form of infertility do at predicting the known Sibly curve? Here is a graph of a number of runs comparing the virtual reproductive rate with population size.
Vertical axis is the number of offspring per individual in the population at generation 1,000. Horizontal axis is population size.
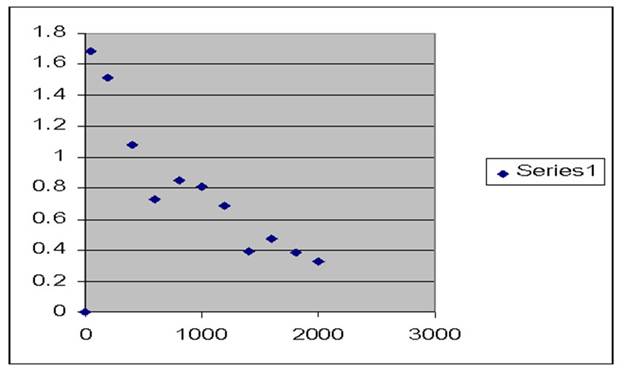
I trust we can accept that as a reasonable reflection of the Sibly curve. This is a straight post-zygotic curve.
The pre-zygotic curve is, for me, problematic. If you follow the time course of a population limited only by a pre-zygotic process, you get something like this:
A single run of a computer program modeling a population affected by post-zygotic infertility increasing with
decreasing consanguinity and increasing population size:
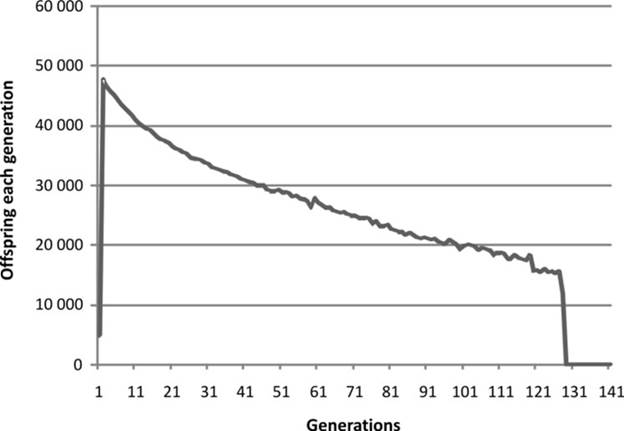
The population tends to go extinct rather early. So in tweaking the program you need to set parameters that have a very small impact on fertility. Lowering the maximum population will extend the lift of the population.
But this cannot reflect real life. No matter how many generations you separate populations of a species you never get absolute infertility in the first generation. There is no absolute pre-zygotic infertility. In fact you can cross breed species. You can cross a horse with a donkey. The result is generally infertile, buy you do get a result.
Somehow pre-zygotic infertility “saturates;” it reaches a point, well short of total infertility where it has done all the damage it can do.
In order better to reflect reality, it might be good to tweak the source code I have shown you. Find the place where the program goes (colored red):
PreZInfertility = 0;
Loss = PreZImpact * MisMatch;
if(Loss >= 1000)
{//32a Lower fertility one offspring at a time
while(Loss >= 1000)
{//33
PreZInfertility = PreZInfertility +1;
Loss = Loss - 1000;
}//33
}//32a Lower fertility one offspring at a time
else
{//32b No whole offspring lost
}//32b No whole offspring lost
coin = rand();
Coin = coin % 1000;
if(Loss > Coin)
{//34a Lose fractional offspring
PreZInfertility = PreZInfertility + 1;
}//34a Lose fractional offspring
else
{//34bKeep fractional offspring
}//34b Keep fractional offspring
OffspringComing = OffspringComing - PreZInfertility;
}//29a PreZsites > 0
else
{//29b PreZsites = 0
}//29b PreZsites = 0
Now we don’t want OffspringComing (if that’s not self-explanatory, look it up in the program) to drop below 2 on the basis of pre-zygotic infertility alone. So we’ll say:
if(OffspringComing < 2)
OffspringComing = 2;
And stick it in here (in blue):
PreZInfertility = 0;
Loss = PreZImpact * MisMatch;
if(Loss >= 1000)
{//32a Lower fertility one offspring at a time
while(Loss >= 1000)
{//33
PreZInfertility = PreZInfertility +1;
Loss = Loss - 1000;
}//33
}//32a Lower fertility one offspring at a time
else
{//32b No whole offspring lost
}//32b No whole offspring lost
coin = rand();
Coin = coin % 1000;
if(Loss > Coin)
{//34a Lose fractional offspring
PreZInfertility = PreZInfertility + 1;
}//34a Lose fractional offspring
else
{//34bKeep fractional offspring
}//34b Keep fractional offspring
OffspringComing = OffspringComing - PreZInfertility;
if(OffspringComing < 2)
OffspringComing = 2;
}//29a PreZsites > 0
else
{//29b PreZsites = 0
}//29b PreZsites = 0
You might have to play around with that “2” a bit. Or maybe you can come up with a better logic.
At all events nature puts a limit on how savage the pre-zygotic infertility can be. There is a selective advantage to this. It is possible occasionally (although only occasionally) to bring a total outsider into a population. That outsider might be carrying a very advantageous gene, one that the local population might have to wait a very long time to acquire by mutation alone.
So if all seems to be hanging together. The theory of course is the source code itself; that is the model of the mechanism we are after, the mechanism that bodes so ill for our long-term survival.
Don’t fret. We’ll not have to go back into the nitty gritty of the code again, I am thinking. Next, we shall look at mating patterns; that talk will be very speculative. You won’t have to believe it at all. Then we’ll look at some more experimental results.
Terror 25 Mate for Love or Status
https://www.google.com/search?q=dore+illustrations+for+raven&source=lnms&tbm=isch&sa=X&ved=0ahUKEwjbz_apjZTaAhUPM6wKHZSwBaoQ_AUICigB&biw=1260&bih=641#imgrc=9yXhz_7MjO5lyM: downloaded 3/30/18
It is the 15th of April 2018. The theory of the mechanism that links kinship and fertility, which is to say that program for which you have the source code, can give a number of patterns for the time course of population size over many generations.
The first is a constant population. That is sort of the skeleton in my closet. I have not been able to produce such a behavior although I have not pursued it with much vim nor have I pursued it after tweaking the program to limit the effect of pre-zygotic infertility. I am discouraged from the attempt because of the very noisy quality of my results. Using the computer at which I now sit, I could in theory increase the number of sites affecting infertility from 100 per segment to about 2,000 per segment in the arrays. That would reduce the noise, I expect, by a factor of 40 or 50, which probably would be enough. I entreat you to do it yourself.
A pattern I do find is damped oscillation:
Graphing offspring on the vertical axis against successive generations on the horizontal
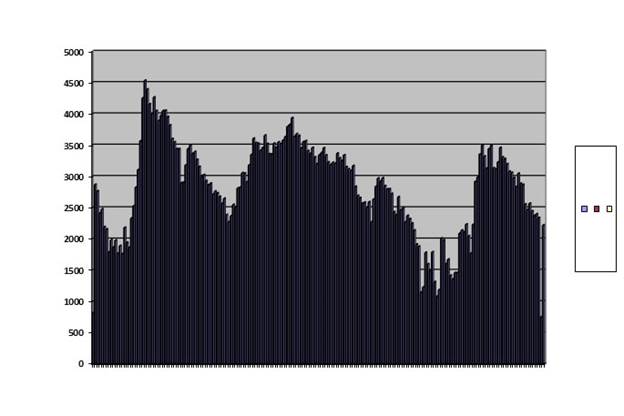
This curve was obtained with a run in which only 200 of the saved population were brought out and run; all other conditions were identical with the baseline. This is an ungainly example, but it can be seen in wild voles, as we have seen, and in captive fruit flies. As lest so far as our data goes, these animals never exhibit any other pattern although they have the opportunity. This pattern is a winner. I have never seen it in a population that went extinct.
A second pattern is the double peak:
Conditions were identical with those of the baseline run except that maximum population was permitted to rise to 3,000.
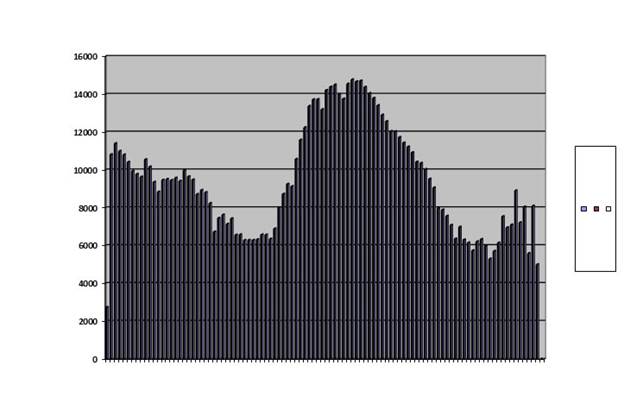
We have seen this double peak in the survival of civilizations and dynasties, in the farmers of Long House Valley, and in wild mouse populations in Australia. None of these, neither human nor murine, showed damped oscillation in spite of ample opportunity. This pattern is a loser. Extinction always supervenes.
A final pattern is a single peak and a crash:
I let the maximum population rise to 4,000, but otherwise kept conditions identical with the baseline run and the run with two peaks.
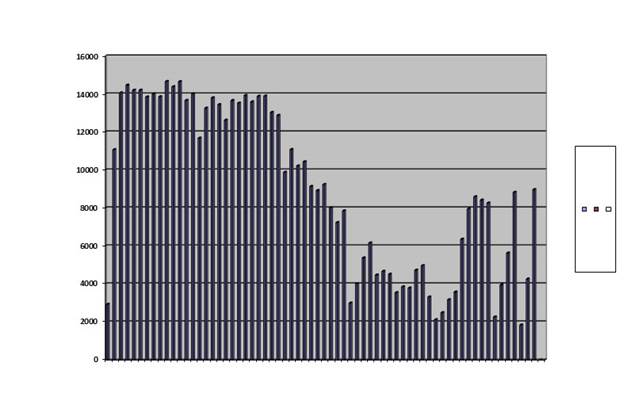
It died out after 67 generations. Ignoring the abortive final rally, the pattern looks like fast up, slow down, tends to level off and then collapse. This pattern has been seen in Canadian weevils, captive mice and wild mice. It is a loser, always leading to extinction.
So we can clump animals into two kinds, those that have damped oscillation and those that have the double peak. Allow me to speculate on the difference.
There are two ways animals are attracted to each other: they may be attracted by kinship, which has been shown by Bateson in his Japanese quail, and they can be attracted by status, which has been shown by Calhoun and his mice. Forgive me if I phrase that in some animals mate selection is based predominately on love and in others it is based predominately on status. Quail and fruit flies look for love, humans and mice look for status.
This suggestion is frivolous, but not entirely frivolous. In theory it could be tested. Imagine some arrangement whereby every fly in a fruit fly colony could be traced throughout it’s life for a few generations. Possibly an MRI study run twenty-four, seven could be done without cooking the flies. The result would have to be analyzed by computer, and the cost would be prodigious. But in the event such a study were practicable, the prediction would be that the flies would have a relatively high frequency of forming mating pairs with nearer cousins. In fact, I shall risk ridicule and say that they would form these bonds while they were still maggots.
Terror 26 Methylation
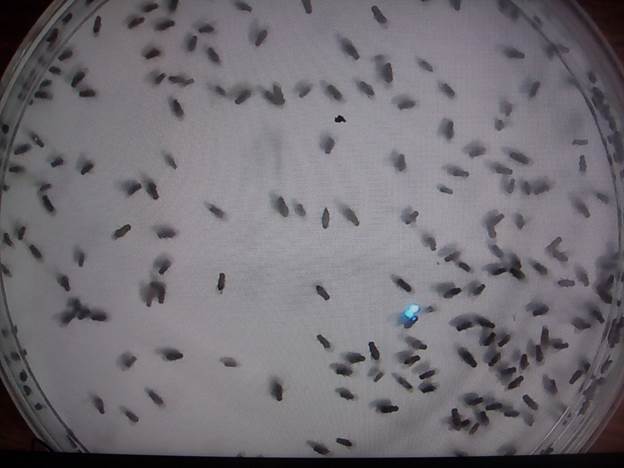
It is the 24 of April 2018.
Previous work with fruit flies had suggested that kinship does indeed change fertility in these insects and that the change is so rapid and cyclic that it cannot be due to DNA mutations but must be brought about by an epigenetic mechanism. There are a number of epigenetic processes, but the easiest approach seemed to be to exploit the fact that methyl groups on DNA can alter the function of genes.
Accordingly I made a cocktail that was reported by Waterson in Diet-induced hypermethylation at agouti viable yellow is not inherited transgenerationally through the female.
Waterland RA, Travisano M, Tahiliani KG.
FASEB J. 2007 Oct;21(12):3380-5. Epub 2007 Jun 5.
I took 30 grams choline, 30 grams betaine, 30 milligrams folic acid, 3 milligrams vitamin B12, 15 grams l-methionine and 30 grams of zinc made up to 1 liter with water. The pills did not dissolve completely, so there was a lot of mixing to assure a consistent content. I called the full strength 100% and did dilutions from there. I found in a side experiment that the flies could tolerate a 40% dilution, but not much more. Waterson apparently worked up to a level where the methyl receptors were saturated. This in flies might have produced a maximum fertility, but that would have been hard to interpret. So I did a control baseline, during which the flies underwent a complete cycle of damped oscillation and then gave them a 40% dilution. Daily counts were made in two windows of the cage and then added together every 2 weeks.
The schedule was this:
Table 1
Dose |
Begin |
End |
Baseline |
July 11, 2010 |
December 8, 2012 |
40 % |
December 9, 2012 |
January 5, 2013 |
30 % |
January 6, 2013 |
April 29, 2013 |
20 % |
April 30, 2013 |
July 23, 2013 |
16 % |
July 24, 2013 |
November 13, 2013 |
13 % |
November 14, 2013 |
March 1, 2014 |
11 % |
March 2, 2014 |
June 23, 2014 |
9 % |
June 24, 2014 |
October 3, 2014 |
7.5 % |
October 4, 2014 |
January 6, 2015 |
6 % |
January 7, 2015 |
April 28, 2015 |
5% |
April 29, 2015 |
August 19, 2015 |
4% |
August 20, 2015 |
November 12, 2015 |
Daily counts in two windows continued and the results pooled over 2 week intervals were examined
The result was
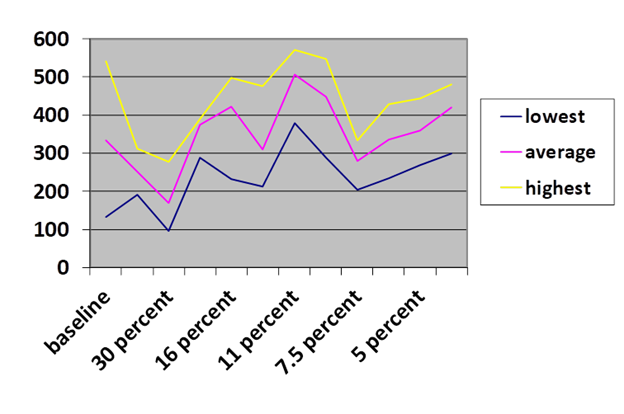
The first observation is that yes, methylation seems to have an effect on fertility. My first impulse was to give 90% confidence intervals, but since there is no certainty that the data are distributed on a normal curve, it seemed clearer at every two-week interval to give an average, a highest value and a lowest value.
There are a number of things that might be going on: 1) there might be a toxic effect from the supplements. 2) There might be a nutritional effect from the supplements. 2) The dilutions are changing. 4) There is definitely an underlying post-zygotic process. However, even using all three I do not see how this complex response could be caused.
Until someone comes up with a better explanation, we are left with the weight of the evidence indicating that there is at least one pre-zygotic mechanism and at least one post-zygotic mechanism and both of these are mediated by a process involving methylation.
Terror 27 Folic acid effect
https://www.google.com/search?q=dore+illustrations+for+raven&source=lnms&tbm=isch&sa=X&ved=0ahUKEwjbz_apjZTaAhUPM6wKHZSwBaoQ_AUICigB&biw=1260&bih=641#imgrc=9yXhz_7MjO5lyM: downloaded 3/30/18
It is the 24th of April, 2018.
Having found the weight of evidence to suggest that methylation drives fertility in fruit flies, we must conclude that the statement, “Only kinship determines fertility, minus rare disaster,” is incomplete. One must add, “And methylation has an effect.”
Pursuing the issue further, I wondered if the entire cocktail used in the previous experiment was actually needed. Would folic acid alone have an effect? In the earlier study, it cocktail seemed to have a significant effect over an entire order of magnitude of dilutions. Doing the same study with only folic acid would have taken years.
But in fact there is only one concentration of folic acid that is of the greatest importance. Women who are pregnant or liable to become pregnant are advised to take folic acid regularly. Received wisdom is that since folic acid is water soluble, it does not accumulate in the body so large doses are given with impunity. Now folic acid is not itself a natural food, but is though to substitute for “folate” compounds, three micrograms of folic acid being the equivalent of five micrograms of folate. That dose of folate is about what is found in an apple, if eaten seeds and all. So three micrograms of folic acid, or one ripe apple daily, should be a pretty good amount even if the rest of the diet is lacking.
“Should be” is not “is,” and what I am about to say must not be taken as advice but as an inducement to further study.
Folate is a necessary vitamin. Its lack can lead to a lethal anemia, since it is necessary for DNA replication, which is necessary for cell division. Moreover, a lack of folic acid is correlated with a condition called a neural tube defect in a developing pregnancy. The condition can range in severity from an almost trivial sinus tract in the small of the back to a devastating neurological malformation. The condition can be prevented by folate about half the time.
So current practice is to give a woman hundreds of micrograms of folic acid a day. Please do not eat a hundred apples a day seeds and all; that would include enough cyanide to kill you even though cyanide is nicely soluble in water.
So the pressing question is whether the current recommended dose of folic acid is safe.
Previously I had no idea what dose of the cocktail had an effect, and it took years to look at a range of values. But now I could focus on a single dose of a single chemical.
As best as I could, I prepared two feeding formulae for the flies. One was the standard recommended by the supplier. The other was mixed not in straight water, but in water that had been given folic acid. The amount was chosen such that the final food would have the same amount of folic acid per calorie as a woman eating a good 1,800 calorie diet, supplements and all would get.
I’ll not give you the actual number of folic acid pills I used. Figure it out for yourself if you choose to run the experiment, which I most urgently beg you to. The routine was to add four males and four females to a vial and follow them for two weeks. After about 11 or 12 days fresh flies would begin to emerge. As soon as they did, I would shake them out into a vial to be kept giving them normal food. There were three control vials and three fortified.
At the end of two weeks, all the flies that had emerged from all the control vials and all that had emerged from the treated vials were added together and are reported below. I must mention that shaking the vials out requires a bit of a light touch. Shake too little and most of the flies remain in their vial. Shake too hard and the food may drop out as well, drowning a lot of the flies and wrecking the experiment. Good luck. I ran the flies, all six vials, in the control medium for a couple generations and then started adding the spiked water to half of them. This is what I got.
 Caption: The horizontal axis is five successive generations of flies. The vertical axis it the sum of daily counts as described in the text.
It seems to me that the folic acid reduces fertility. In terms of the computer program it is increasing the rate at which sites that affect pre- and/or post-zygotic fertility change with a resulting difference between critical areas on chromosomes and thus reducing the number of offspring.
Please, somebody with a better hand, better resources and access to peers give this a try. Failing that, any youth could do it as a high school science project. You don’t really need a dissecting microscope. There are cheaper ways to magnify the flies and be sure of the sex.
Terror 28 Years till Doom

It is the 24th of April, 2018.
"Uh, Houston, we've had a problem," as the man said. We have seen numbers that suggest the fertility in Sweden, and by extension the productive middle class worldwide will collapse in 2024. If the youngest person in that class is 50 or over, it is hard to see how our high-tech civilization can survive. We’d expect a calamity around 2074.
And now we have folic acid, pretty much given to women in the middle class worldwide, reducing fertility in fruit flies by maybe 50%. Since the fertility in the middle class is, and has been for about 30 years, below 2, that leaves a fractional baby per woman. That would be zero. Oh, you say that’s an average. Maybe, but you can’t be sure. Folic acid supplementation began in 1986. Women born having babies since then have had babies impacted by the supplement, and just might be infertile anyway. They will reach 38 in 2024.
If the American era began in 1776, and if the rule of the 300 year brick wall holds, our civilization will collapse in 2076 at the latest, with the youngest person reaching 50 at that time born in 2026 or slightly before.
I think one might be forgiven for squirming a bit. Of course, it might be possible to transfer our science and technology to less developed countries, but that would be insufficient. The must be transferred to people not presently in the middle class; there are lots of middle class people in every country, but they may be keeping pace with the global middle class.
All right, we have one more data set that we might draw on. We’ve seen it before. It’s Long House Valley.
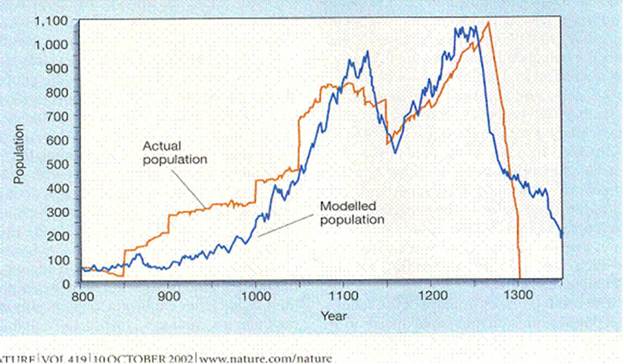
Jared M. Diamond, “Life with the Artificial Anasazi,” NATURE, vol. 419 no 6907, October 10, 2002 p 567
Ignoring the blue tree ring line, which I take to be the result of human activity, the red population line dives to zero in the year 1300. That would be when the last person reached 50 years old, assuming any society needs a certain amount of bull work done that only a young man can accomplish. That would mean the last baby was born in 1250.
The number of occupied houses continues to rise for about another 20 years, so the “population” is rising but that may only mean more people are reaching 20 years old and starting their own homes.
After a slump, a building boom starts in about 1150. That would imply a baby boom 20 years earlier or 1130. So the time from the last baby boom to the last baby is 1130 to 1250 or 120 years.
Our own baby boom started in 1946. If we follow the same time course, the last baby will be born 120 years later or 2066.
So there is a ray of hope. Ignoring all the other lines of reasoning, that gives us 48 years. That is long enough so it might be possible to accomplish something.
But we’d need to start working on the pdq.
Terror 29 Religion
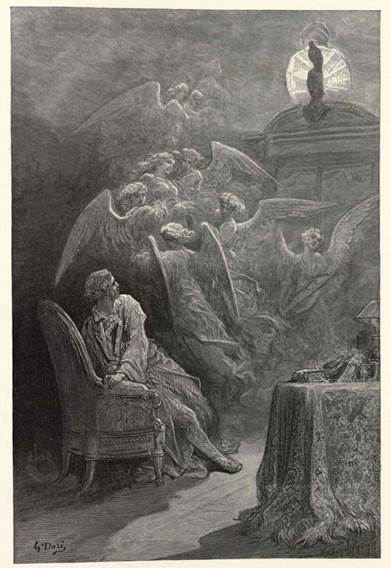
https://www.google.com/search?q=dore+illustrations+for+raven&source=lnms&tbm=isch&sa=X&ved=0ahUKEwjbz_apjZTaAhUPM6wKHZSwBaoQ_AUICigB&biw=1260&bih=641#imgrc=9yXhz_7MjO5lyM: downloaded 3/30/18
Golden eagle call: https://www.youtube.com/watch?v=66M4ZSjvGUQ
It is the 26th of April, 2018.
A rule of good manners is never to talk about religion or politics.
But I suspect that they are more than relevant to what we are doing, so I make bold the raise the issues, but with a warning. Unlike the talks heretofore, nothing here is based on hard statistics. So either skip the next couple of talks or be prepared to cherry pick them, noticing anything that seems plausible and flatly rejecting anything you don’t much like. My experience is that when people are exposed to this topic, they are most likely to dismiss it in defiance of the evidence and they either ignore or attack me. Fair enough if it means trying to get the truth across, but for this kind of speculation, I don’t feel like fighting.
An early manifestation of what may have been a religious impulse was the creation of figurines like this:

These feminine creations were made over a long period of time. I am told that this one is 7,000 years old. She is decorously if scantily dressed; you can just see the edges of the sleeves. Received wisdom is that she has something to do with fertility. I tend to agree. If then as now infant diarrhea was a scourge, it would make more sense to worry about keeping children well than having children at all, at least if fertility was not a problem. But we have no idols to the formed stool god. This was before people began to form large identity groups and villages may have communicated easily, which of course would have doomed them to the 300 year brick wall we have seen so often. If a typical village was in contact with six adjacent villages and a dozen beyond that, the eighteen on average would have one collapsing every sixteen or seventeen years. Everyone would have known about it and worried about it.
If one defines religion as worship, then no religion is “wrong” so to speak. On the other hand, opinions about the best approach to worship and the best understanding vary enormously. To some extent, this may be biologically advantageous. If different religions encourage people to marry strictly within congregations but be happy to mingle with other congregations for other purposes, that might permit people to enjoy the blessings of a complex society, including high technology and enlightenment ideals, without the curse of childlessness. Of course, far more conspicuous is the degree to which religious differences can lead to horrible behavior.
I’ll come clean and say I am a Methodist. I didn’t think up that religion = worship idea. That’s Methodism. As a rank and file, if rather rarely gathering, member I also take Scripture to be a collection of works by different people at different times which are worth serious study but are amenable to more than one interpretation. So let me offer some non-standard interpretations.
Adam and Eve ate from the Tree of the Knowledge of Good and Evil and that resulted in them leaving their original garden and losing access to the Tree of Life. Let me propose that we are to understand that to be “The Tree of Knowledge of Life.” And that is precisely what we have been learning about. If you know the Tree of Life, you don’t have to die out. On the other hand, the danger is for you to say as some say sweetly and some scream at me, “But that’s not right,” as much as to say, “That’s evil.” Ok, I’m pushing on that one, but it’s remarkable that it works out.
Lot was fabulously rich and living in a town called Sodom. He learned that all the men in town were gay; his daughters had friends but were not attracting marrying material. They left, accompanied by special effects which are the reason you remember the story and went to another town. What they did not mention in Sunday school was that the daughters soon told him this town was just like the last one. So, they took him out into the countryside, got him drunk and had their way with him. It worked; they got pregnant.
Old men marrying nubile women may indeed have happened a number of times and resolved a fertility crisis more than once. That might account for the otherwise strange fact that women are more attractive than men, yet traditionally take all the risks of having children and the work or rearing them. If the man brings home some money the woman may not feel hard done by. If he fails to provide, she’ll feel hard done by but she’ll manage.
It's quite a nice deal for the men. Oh, yes. Males are amazingly sex oriented. A young man will be aroused if he simply falls asleep. Animals fall asleep but unaroused. Arousal is the default setting for men, only temporarily interrupted by waking issues. Very young men will reach climax. That’s as unique as the opposable thumb. I suspect the heightened drive is so that, like Lot, they remain vulnerable to feminine wiles into advanced age.
Moses led the Israelites out of Egypt and presented them with the Ten Commandments, the copy being carried in the Ark of the Covenant. So, they aren’t commandments; they are a covenant, a contract, a deal. On the one hand the people are to agree to have no other gods. Since marriage traditionally is a religious ceremony, that can be construed to mean don’t marry out of the congregation. After that order has been repeatedly hammered home, there is the other side’s turn. It’s a list of bad things the people will not do. The promise is, “You will be decent people.” Now if a person loses self-esteem, that person will become depressed and contemplate suicide. Offering to make people be decent is the ultimate prize.
The hooker here is (I prefer the King James Version of the Bible or the Tyndale version; anybody else I suspect of having an axe to grind.) the passage, “Honour thy father and thy mother: that thy days may be long upon the land which the LORD thy God giveth thee.” I do not read Hebrew, but I can use an interlinear translation. The word “that,” meaning “so that” is an anachronism. It appears here and there in the first books and most frequently in Deuteronomy. Then it never appears again; there are other ways to say the same thing. The Deuteronomist stuck it in there, yeah, he had an axe to grind, too. So take it out, and it becomes, “You’ll make your parents proud. You’ll live a long time.” See? Blessings.
When Daniel was a boy among the captives from Judea being held in Babylon, He and some other boys were tapped to be educated to become administrators. That is high status work, and one might have expected that the administrators themselves would have been eager to have their own sons take over after them. But if Babylon, which was one – actually two – of the civilizations we looked at in lower Mesopotamia, if Babylon was having a fertility crisis, it makes sense.
If we are to believe all the stories, it worked out marvelously. Babylon built the mighty temple of Marduk and the Hanging Gardens during those years. The story that comes to us is that the Medes and the Persians took Babylon with a trick, but it may have been just a lack of capable young Babylonians in the administrative class and among the high-ranking officers.
In fact, there just might be a chance that some actual statistics might be brought to bear. One wonders whether the surviving clay tablets have any Hebrew messages. Probably not, I think. The young Hebrews would have been expected to learn the then current language. On the other hand, if Babylon, or any other lower Mesopotamian culture maintained sufficiently extensive birth records, we might be able to read their doom as inscribed by their own hands. We might see birth rate collapse just before the end.
Terror 30 Politics
Polite folks really don’t talk politics. For some years, going into 2017, I had a couple of friends, both middle aged men living alone, who had cultivated me rather than vice versa. We would meet once a week for lunch, but the three of us would not gather. One was quite right wing in his politics, the other quite left wing, and I doubted they would get along, so I’d lunch with one one day and the other another day. Of course we discussed things of interest to them as well as what I have been talking about here. But shortly after Mr. Trumps inauguration I mentioned that a lot of people had been surprised by his election, but I was not among them. The liberals had been listening to themselves talk and had done the liberal thing of marrying far from family. The conservatives had married in family a bit more. So there was a gradual demographic shift towards nationalism, isolation, and populism (not that I really know what that means) and the elections were simply following the demographics.
Within a week, both of these worthies had made it clear that had no saw no further use in seeing me and broke off.
Please don’t take that attitude. I’d rather you muttered “balderdash” and leave the topic. You see, this is simply more important than politics. In politics, basically any regime serves only at the will of the people. That’s true of modern free republics like the bulk of the rich world and of places like ancient Rome, where it seems to me that an emperor’s term ended when his Praetorian Guard murdered him.
A lot of people live in dread of their own government. If you cruise the offerings on YouTube you may find such people. And governments fear the people. We used to have a saying, “She read him the riot act.” That meant she scolded him. It seemed to have meant that every government had a riot act, such that if civil disorder appeared it was put down with excessive savagery. The say a riot about chariot racing in ancient Constantinople let to so much mayhem from the government that the city never recovered its power. Of course, I doubt that. Populations collapse from infertility, not from people getting killed on the street. There is, after all, generally some inside space in most cities.
There is a question as to whether nationalism is on the rise internationally. There’s a bit of irony for you. Countries insist on their national identity and proceed to do just what all the other countries are doing.
If, indeed, these political shifts are due to demographic shifts, I would expect them to continue. But it won’t last. Whoever seizes control of the moment may establish a semi-durable regime, but since the whole world is on the same demographic course that regime will collapse, and probably not many years later.
Now run away and forget I said anything. I have no numbers. If you know how to put relevant numbers together, consider the topic yours for the taking.
Terror 31 Robin Fox

https://www.shutterstock.com/image-photo/raven-on-barren-branch-moon-hidden-238133287?src=zsRB6ETKXxgItOF7pII80w-1-52
Downloaded 4/22/18
We are about to wrap this up, and I would like to pause first and repeat something I said but failed to emphasize. The abiding presence in this field is Professor Robin Fox of Rutgers. Rather than attempt to repeat or summarize his biography in Wikipedia, I invite you to read it. So far as I know, he is the only authority I have cited who has been a bullfighter.
Back in 1967 he published Kinship and Marriage: An Anthropological Perspective, which is still a standard textbook in anthropology. Among his many interests, more than one had approached the current subject of kinship, mate choice and fertility, but it is beyond question that in that book he is in the same ballpark. Then in 2015 he wrote a chapter “Marry In or Die Out” Optimal Inbreeding and the Meaning of Mediogamy” in Handbook on Evolution and Society Print publication date: January 2015 Online publication date: November 2015.
This I think is simultaneously in the title the most terse and clear summary of the issue and in the chapter itself the first publication explaining the issue by a professional in what will be the conserved corpus of scientific writing.
I salute you professor. You founded the field.
Terror 32 Wrap up
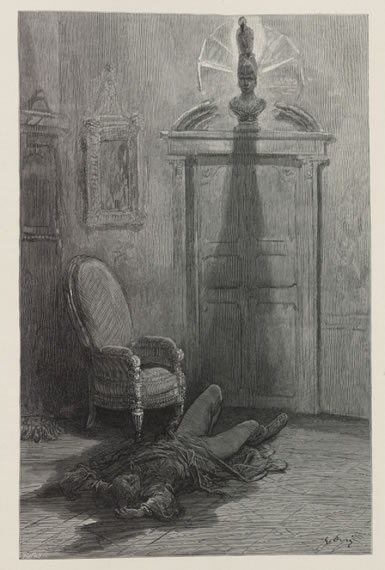
Dore “Raven”
https://hyperallergic.com/102457/rediscovering-the-dark-splendor-of-gustave-dore-with-edgar-allan-poe/ downloaded Feb 18, 2018
At this point it may sound like people are a wretched lot. If indeed by marrying for status and not love we are trapped in a pattern like that of mice that leads straight into oblivion, we are doomed, and its our own fault.
But in the first place, it’s hard to believe that the cousin crush, the attraction to appropriate kin is something we are unaffected by. If Japanese quail can sense it, it stands to reason that we can as well. It is probably deeply instilled in us. That’s just an opinion.
In the second place, consider this: since long before we were human we have always been subject to the rule that if a population mates between strangers for more than a few generations, that population is doomed. There is constant selective pressure against tolerance. Yet even today it is possible to talk about peace and tolerance with some people without being ridiculed. Even if ineffective in so many cases, an attraction to peace and love are still at least comprehensible, all in defiance of this particular kind of selection. I think one can conclude that there is goodness in people that endures even such terrible pressure.
We started out long ago talking about inbreeding depression and insisted there had to be a mechanism. But we have been working on the mechanism of outbreeding depression. In fact, the two are one and the same. Consider this graph:
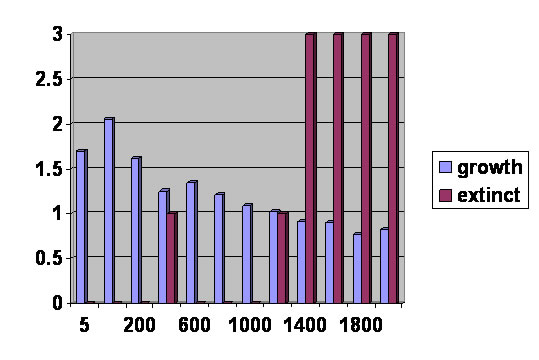
These are 12 simulations done with 10 repeats averaged using a purely post-zygotic mechanism limiting fertility during outbreeding. The vertical axis is the number of populations that went extinct out of the ten (the red bars) and the average number of offspring per individual at generation 1000 (the blue bars). The horizontal axis is the population sizes. Ignore the red bars. They increase at large population sizes. There now should be no surprise here. But if you look at the smallest size tested, there are fewer offspring per couple than at the next larger size. There is your inbreeding depression. If you set up a mechanism limiting fertility in large populations and include a component that is post-zygotic, you will get inbreeding depression, too.
At last inbreeding depression makes sense. Since it is not, as we saw, an automatic consequence of genes, it has to be a superimposed mechanism produced by selection. But if a population is in trouble and has become very small, inbreeding depression is the last thing. It needs. In fact, it is the inescapable byproduct of the absolutely (for complex organisms) necessary presence of outbreeding depression.
More years ago than I can easily believe I did my honors thesis for college on King Arthur. For my purposes, it was only fiction, but as such it has had amazing staying power. It was and is easy for me to understand the long-standing popularity of Homer and Shakespeare. Both have intense and intricate dramatic situations, well-crafted characters in intense relationships and a polish we ordinary mortals only wish we could create. The Arthur stories pretty much lack all of these things. As I plugged away the thing that distinguished the stories was the quest for the Holy Grail. So, I learned something about it.
The historical existence or not was not for me a burning question. Whether Arthur ever lived, he certainly was not around during my college days, but the stories were.
Now after a lifetime I look back and a few things seem plausible. After the Romans left Britain, the culture was dominated by some people known at the time I was writing as the Celts. The meaning of that word has changed, but at the time they were well characterized with a tribal tradition, traditional artwork and languages that tied them in with parts of continental Europe. The domination by the Celts of this highly desirable piece of land was challenged by tribes of Germanic Saxons. Now I say “dominated” because I do not mean to say that I have evidence that they were all “Celtic.” But the elite clearly were.
The Saxons advance. The Celts turn at bay. There is a battle at Badon Hill. The Saxons run like rabbits. Years afterwards, the Saxons return and take over.
And now you and I share a bit of knowledge neither of us had back in the day. The technology of the time cannot have been much different from that of lower Mesopotamia during most of its history. Mesopotamian civilizations fell because their fertility, or at least the fertility of the elite collapsed. So, the ultimate victory of the Saxons is easy to understand; the Celts, their leaders, died out.
Roll forward some six hundred years and a French writer, Chrétien de Troyes , takes up the tale and introduces the Holy Grail. It seems to me that there are about as many theories about what it was as there have been writers commenting on it, but one thing stands out. The Holy Grail had the power to restore people to a land that had lost its people. Cloning was not available at the time, so I shall take a bit of liberty with the tale and say what it could really do was prevent the collapse of a population.
Forgive me if I speculate on history. The Celts were dying out. Some of them sallied forth to see if there was a way to fix it. Had they asked around locally, it would have raised few eyebrows. Anyone could see the problem. But if a few had gone over to France, they would have made quite the impression. “You came here from Britain for what?”
Somehow the legend got tied up with something to do with love. So do not think too low of the Arthur characters and colleagues. They saw there was a problem. They looked for a cure. They suspected it had something to do with mate choice. It would be almost another thousand years before anybody came that close. The Holy Grail? It’s what you are reading or listening to right now.
I have probably waited too long to address this, but there is a line of skeptical thinking one must respect.
Saxon invasion of Britain was halted by the battle of Badon Hill in 516, and the Saxons were held off for “many decades,” (https://www.google.com/search?q=when+was+the+battle+of+badon+hill&oq=when+was+the+battle+of+badon+hi&aqs=chrome.1.69i57j0.10154j1j8&sourceid=chrome&ie=UTF-8) let’s say until the battle of Catraeth in 600.
But the Saxons did not have it all their own way. By the year 800, they were under attack by Vikings, which went on until the Norman Conquest of 1066. So far so good; regimes get into bad trouble within 300 years.
But in 1066 something remarkable began. 1366 came and went without utter disaster. Those who were descended from titled families at that time were not slaughtered – the standard sign of regime change, sufficient if not necessary. In the early 1300’s there were troubles with Scotland, a famine, there were some palace coups so to speak, the hundred-year war began, England won the battle of Crecy; it just does not have the feel of decadence. Jump to the early 1600’s: royal houses of England and Scotland unify but not the parliaments, Jamestown founded, the Civil War defeats the monarchy, but by golly the monarchy comes back. And so goes it forth. The regime change, the real one, certainly not the slaughter of the prior elite, never comes. It’s going on a thousand years. Egypt never broke 700 years. On the face of it, the whole idea that demography brings down regimes within 300 years seems to be in tatters. What gives?
I think the answer can be found in this map (or the map this is part of).
Part of a map of Dorset published in 1695. A “hund” is a hundred “hides” (enough land to support a family) and measures about 6 miles across. From center to edge is about an hour’s walk with a two-way cost of 6 hundred kilocalories. That would be about the limit of a young person’s social horizon. The villages are actually smaller than hunds, but probably not air tight. About a hundred families might make up a social pool. The Domesday Book chronicled thousands of villages shortly after 1066. Essentially all are still there after more than 30 generations.
There is your demographic stability. The government was not centralized; interests were dispersed, and there were always bright capable young men who could be called out of the countryside. Other places were either not so rich in cultural and natural resources or were highly centralized. That has been the usual setup for demographic disaster for the elite.
Among the capable young men from a modest family in a small town was Isaac Newton. Along with his scientific triumphs he wrote a book: Newton’s Revised History of Ancient Kingdoms. I read the Larry and Marion Pierce version published in 2008. You notice at once that he was looking at the same information drawn from history as we were – well maybe not the same, but he did his best as have I. To my reading the 300 year brick wall holds in every case but one, which Newton dismisses. I find it hard to believe that the world’s greatest number cruncher and this sad wreck sitting at a keyboard looked at the same numbers and Newton missed the key observation.
So far as kinship, population size and fertility go, he does not let slip a word. Yet the relationship was immediately obvious to me; if I saw it, he saw it, say I. But he breathed not a word in the clear. He does say the exception is “against the laws of nature,” and then explains it away as error. If he had spoken, civilization would have listened. My experience has been different. Funny old world, eh?
A final objection, which I have meant to lay to rest before, I shall return to. If, as seems the case, marrying outside of moderate circle of kinship is effectively killing babies, this could be taken as an occasion for fear and hatred of strangers and of racism, clinging to one’s ethnic group and so forth. Of course, anything can be turned to an ill use, but that would be a gross distortion. The biologically significant unit is far smaller than just about any ethnic group or other group against which or by which hatred can be seen. It doesn’t apply.
On the other hand, once the tyranny of outbreeding depression is understood, it loses its power. If everybody knows better and behaves accordingly, there is no selective advantage to hate. That unwanted reflex should atrophy, and we all live in the peace we so earnestly crave.
Home page.